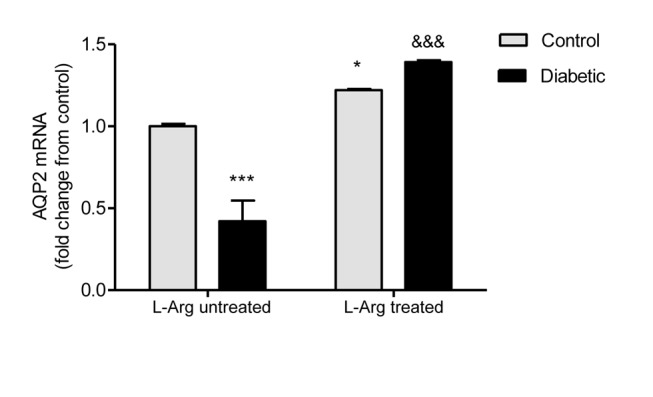
Figure 5. AQP2 mRNA levels in the renal outer medulla.

AQP2 mRNA levels are expressed as relative values from control untreated rats. The following formula was applied: ΔΔCT = (CTAQP2−CTGAPDH) experimental−(CT AQP2−CT GAPDH)control untreated rats. Two-way ANOVA showed a statistically significant (p<0.001) interaction between the effects of Diabetes and L-Arg treatment on AQP2 mRNA expression. Bonferroni’s post- tests: *p<0.05 vs. control untreated rats; ***p<0.001 vs. control untreated rats; &&&p<0.001 vs. diabetic untreated rats. Data are mean ± SEM (n = 6).
