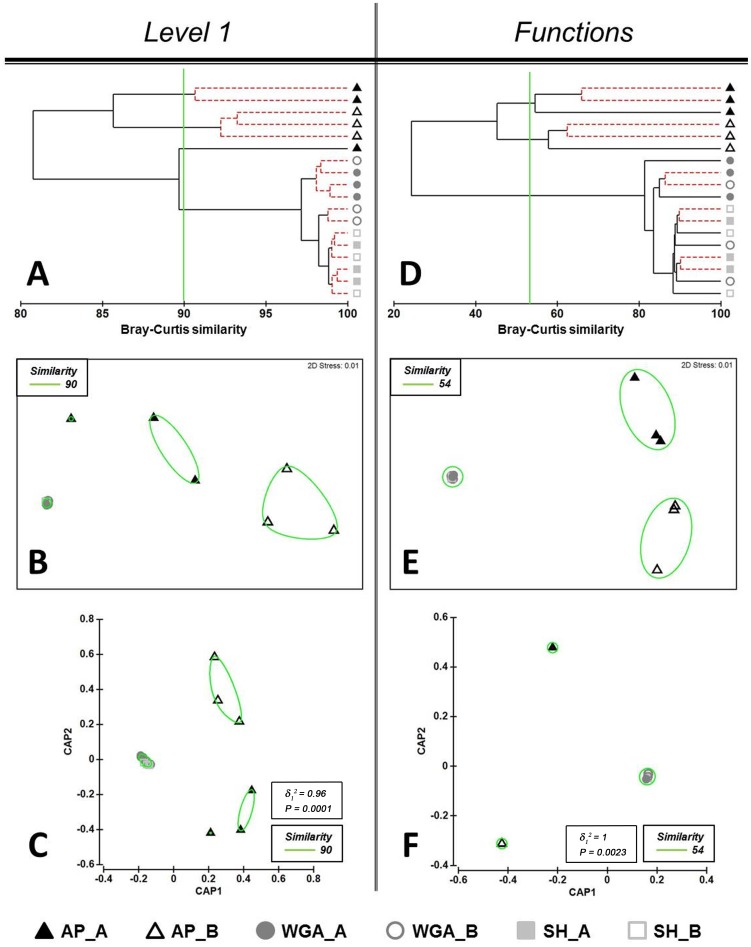
Figure 2. Comparison of the metabolic soil profiles generated on full datasets at the subsystems level 1 (A, B, C) and subsystems function (D, E, F) resolution levels.
Bray-Curtis distance similarity matrix was calculated from the square-root transformed abundance of DNA fragments matching taxa in the SEED database (E-value <1×10⁻⁵). The Bray-Curtis matrix was used for generating CLUSTER dendrogram, NMDS and CAP ordination plots. CLUSTER analysis (A and D). Red dotted branches on the CLUSTER dendrogram indicate no significant difference between metagenomic profiles (supported by the SIMPROF analysis, p<0.05). NMDS unconstrained ordination (B and E). The NMDS plot displays distances between samples. Data points that are closer to each other represent samples with highly similar metagenomic profiles. CAP constrained ordination (C and F). CAP analysis tests for differences among the groups in multivariate space. The significance of group separation along the canonical axis is indicated by the value of the squared canonical correlation (δ1 2) and P-value. A contour line on the NMDS and CAP ordinations drawn round each of the cluster defines the superimposition of clusters from CLUSTER dendrogram at the selected level of similarity.

