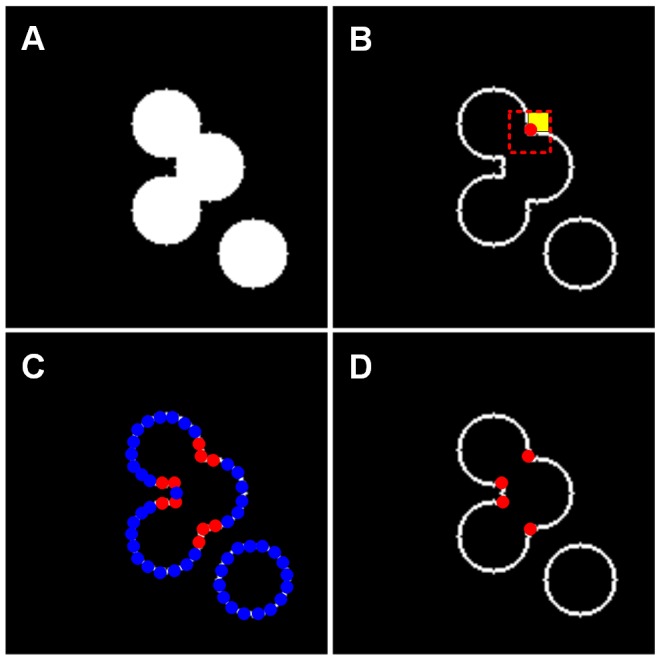
Figure 2. Schematic diagram of concave point detection in a 2D plane.

(A) Binary image. (B) Contour image. The red point is on the contour, and the red dashed box is a mask centered at the red point. The yellow portion is where the mask intersects the background voxels of the binary image. (C) The candidate concave points (red points) meet the threshold condition. (D) The concave points (red points) meet the minimum concaveness value of its adjacent points.
