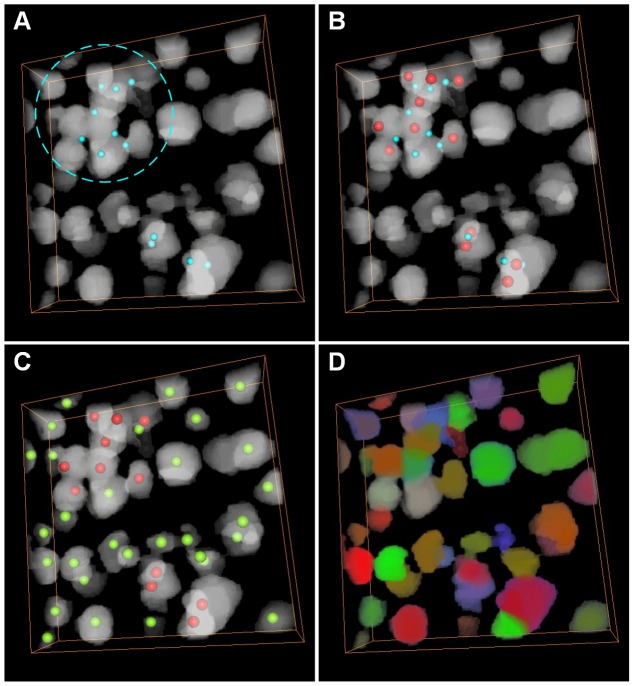
Figure 4. Cell detection and segmentation on the K1 stack.
The stack is a preprocessed binary image and volume-rendered with the color-map's alpha values of 0.2. (A) The CPCC point result (light green points). The dashed circle indicates the cell-touching region. (B) The seed point (red points) of touching cells from the 26 cubic neighbor points of CPCC. (C) The seed points (light yellow points) of sparse cells. (D) Results of the CC-random walker segmentation, where different cells are labeled in unique random colors.

