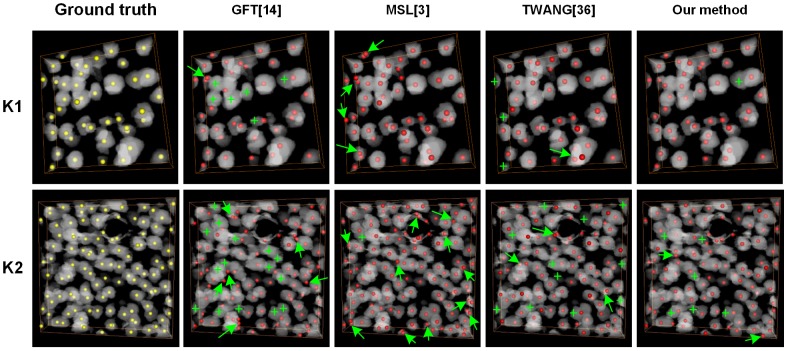
Figure 6. Comparison of different detection results achieved with the investigated methods on K1 and K2 stacks.
The top and bottom rows represent the K1 and K2 stacks. The stacks are preprocessed binary images and are volume-rendered with the color-map's alpha values of 0.2. The yellow points are the ground truth, and the red points are cell centroids achieved through different segmentation methods. The green crosses indicated that the cells that are not detected. The green arrows indicated the false detected cells.

