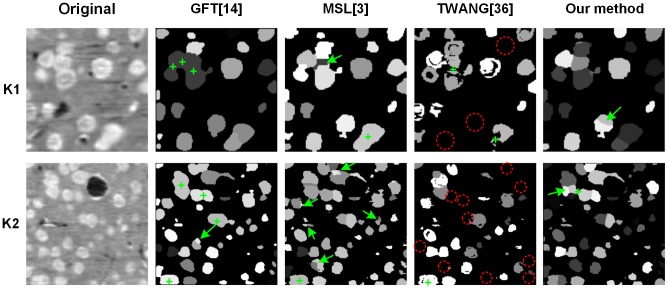
Figure 7. Comparison of different segmentation results achieved with the investigated methods on some two-dimensional slices.
The slices are from the 3D original and segmented results of the K1 and K2 stacks. Each cell is labeled using one gray value in the segmentation results. The green crosses indicate the under-segmented cells. The green arrows indicate the over-segmented cells. The red dashed circles indicate that most of the voxels of one cell are not segmented.

