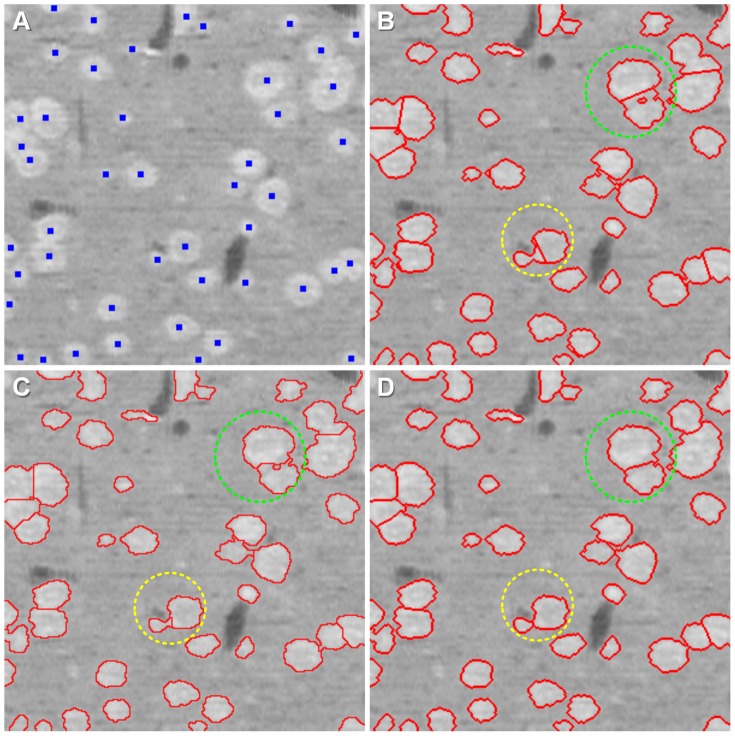
Figure 8. Comparison of the segmentation results using three different methods.
The light green dashed circle indicates the holes in the binarization step, and the light yellow dashed circle indicates detached contours of two touching cells. (A) Seed point (blue points). The three segmentation methods are all based on the seed points. (B) The segmentation results of the k-mean algorithm, using seed points as the initial points. (C) The segmentation results of the marker-controlled watershed algorithm. (D) The segmentation results of the CC-random walker method.

