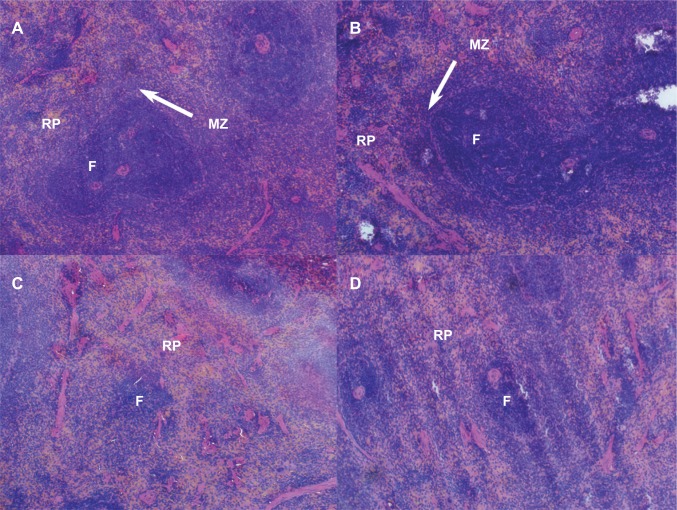
Figure 6.
The pathological photos of spleen.
Notes: Magnification ×20. (A) The control group. (B) The 5% Glu group. (C and D) The PE group. (C) Represents that the proportion of white pulp is decreased and red pulp is increased. (D) Represents that follicles are markedly reduced in size and poorly demarcated from the marginal zone and the lymphoid sheath.
Abbreviations: F, follicle; MZ, marginal zone; RP, red pulp; Glu, glucose injection; PE, PEGylated emulsion.

