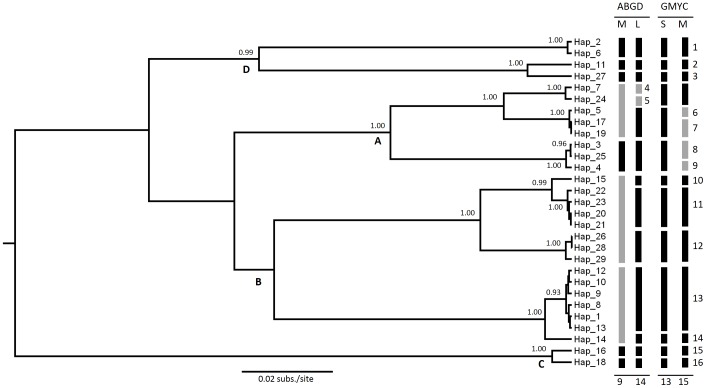
Figure 1. Primary Species Hypothesis (PSHs) delineated with the COI-5P gene.
Bayesian gene tree with posterior probabilities (>0.9) next to each node. Branch tips are the 29 haplotypes detected in the study. Vertical thick lines indicate PSHs delineated with ABGD and GMYC methods; numbers next to the vertical lines are PSH codes; letter A–D next to some nodes indicate major lineages. For ABGD, partitions for the more inclusive (M) and less inclusive (L) results are shown. GMYC partitions include the single-threshold (S) and multiple-threshold (M) variants of the method. Grey thick lines indicate discrepancies between partitions.

