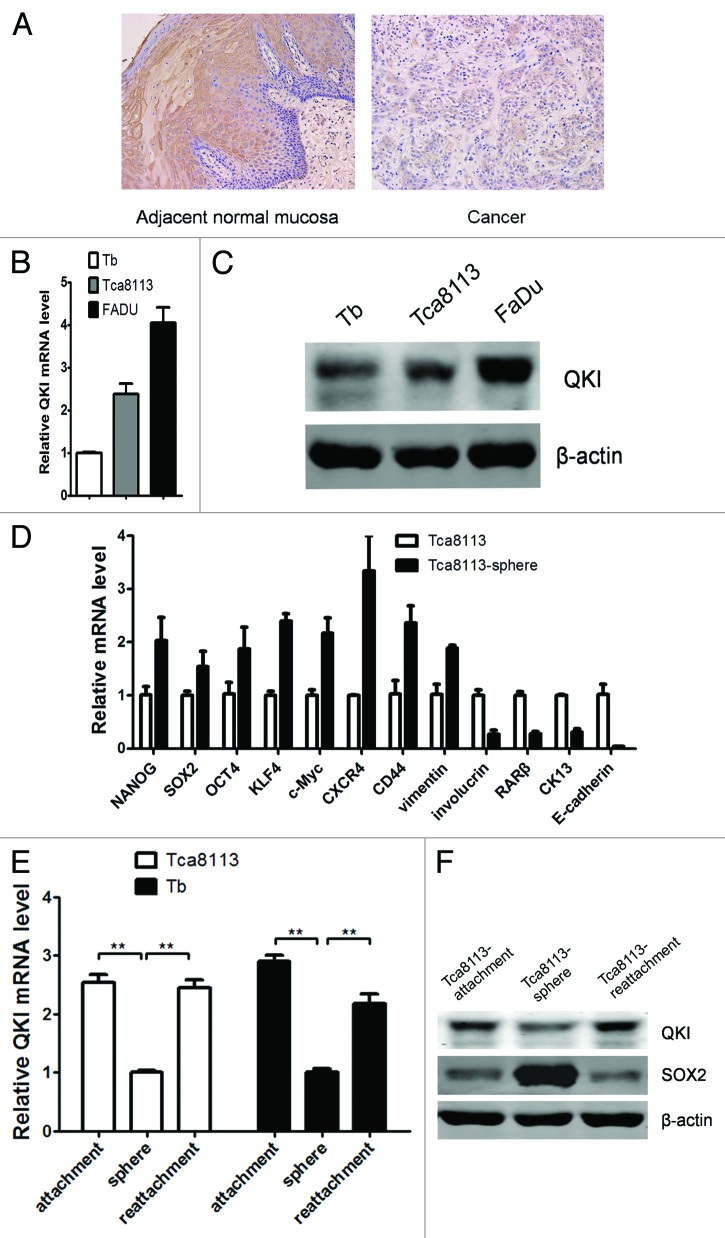
Figure 1. Expression pattern of QKI in cell lines and human OSCC samples. (A) Representative data of the expression of QKI in the adjacent normal and OSCC samples assayed by immunohistochemistry. QKI expression was much lower in most cancerous tissues than that in the adjacent normal counterparts. (B) mRNA levels of QKI in Tca8113, Tb, and FaDu cell lines were quantified by qPCR. Results were normalized to GAPDH mRNA. Data are shown as mean ± SD from 3 independent experiments. (C) Protein levels of QKI in the above cell lines were detected by western blot, and β-actin served as an internal control to ensure equal loading. (D) qPCR analysis was performed for the indicated genes in Tca8113 and Tca8113 sphere cells. Data are shown as mean ± SD from 3 independent experiments. CK13, cytokeratin 13. (E) mRNA levels of QKI in Tca8113 and Tb cells in different culture conditions were quantified by qPCR. Data are shown as mean ± SD from 3 independent experiments. **P < 0.01. (F) Protein levels of QKI and SOX2 in Tca8113 cells in different culture conditions were detected by western blot.

An official website of the United States government
Here's how you know
Official websites use .gov
A
.gov website belongs to an official
government organization in the United States.
Secure .gov websites use HTTPS
A lock (
) or https:// means you've safely
connected to the .gov website. Share sensitive
information only on official, secure websites.
