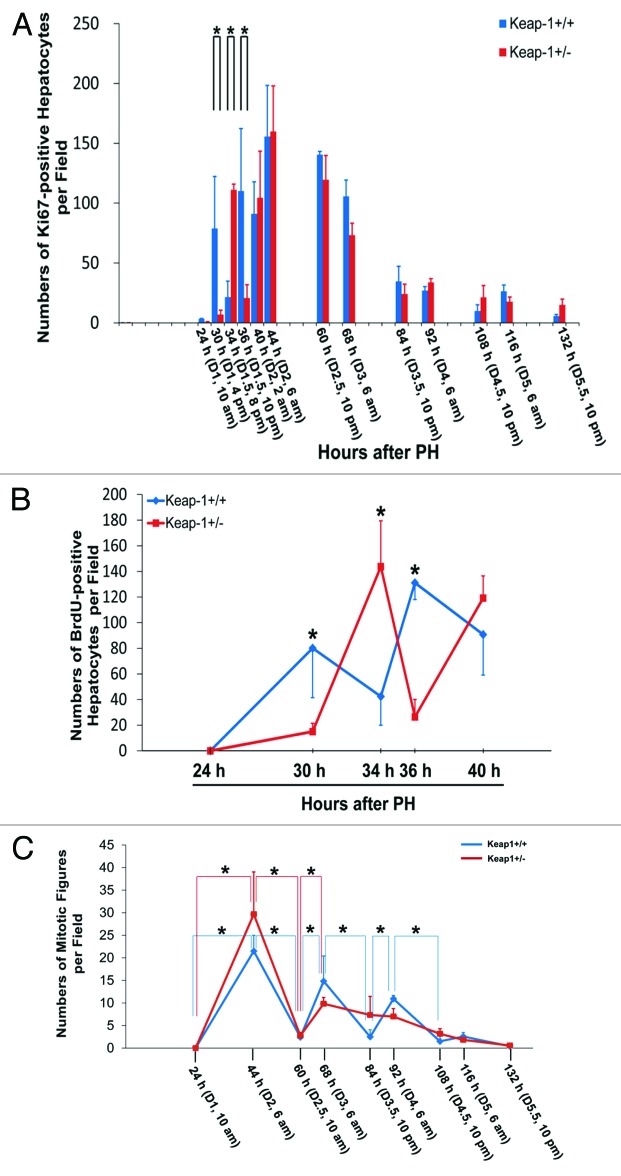
Figure 1. (A) Assessment of total proliferating hepatocytes. Wild-type (Keap1+/+) and Keap1 knockdown (Keap1+/−) mice were subjected to partial hepatectomy (PH) and sacrificed at the indicated time points. Ki-67 immunostaining was performed with liver sections. Ki67-positive hepatocytes were counted at 200x magnification in 5 randomly chosen fields per section. The results are shown as the means per field ± SD (n = 3–8 mice per genotype per time point). Asterisks represent P < 0.05 in comparison between Keap1+/+ and Keap1+/− mice. (B) Assessment of S-phase hepatocytes during the first round of hepatocyte cell cycle post-PH. One hour prior to sacrifice, BrdU was injected into the mice (100 mg/kg, i.p.). Liver sections were subjected to BrdU immunostaining. BrdU-positive hepatocytes were counted at 200x magnification in 5 randomly chosen fields per section. The data are shown as the means per field ± SD (n = 3–8 mice per genotype per time point). Asterisks represent P < 0.05 in comparison between Keap1+/+ and Keap1+/− mice. (C)Assessment of M-phase hepatocytes. After PH, mice were sacrificed at the indicated time points. Liver sections were stained with hematoxylin and eosin. Hepatocyte mitotic figures indicative of hepatocytes undergoing mitosis were counted at 100x magnification in 5 randomly chosen fields per liver section. The data are shown as the means per field ± SD (n = 3–8 mice per genotype per time point). Asterisks represent P < 0.05 in comparison between the time points indicated in each genotype group of mice.

An official website of the United States government
Here's how you know
Official websites use .gov
A
.gov website belongs to an official
government organization in the United States.
Secure .gov websites use HTTPS
A lock (
) or https:// means you've safely
connected to the .gov website. Share sensitive
information only on official, secure websites.
