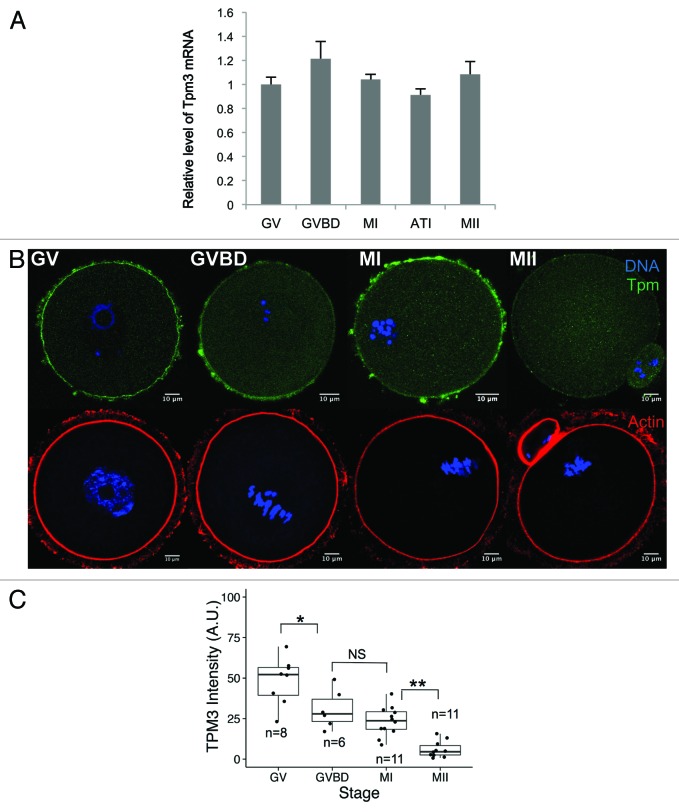
Figure 1. Dynamic changes in Tpm3 expression and localization during mouse oocyte maturation. (A) Quantitative PCR of Tpm3 mRNA during mouse oocyte maturation. Samples were collected after culturing for 0, 4, 8, 9.5, or 12 h, when oocytes had reached germinal vesicle (GV), germinal vesicle breakdown (GVBD), metaphase I (MI), anaphase-telophase I (ATI), and metaphase II (MII) stages, respectively. Each sample contained 20–30 oocytes. Triplicate results are expressed as the mean and SEM (B) Subcellular localization of Tpm3 and actin during oocyte maturation. Top: GV, GVBD, MI, and MII stages oocytes were stained with the Tpm3-specific monoclonal antibody CG3 and this is shown in green. DNA was stained with Hoechst 33342 and this is shown in blue. Bottom: Oocytes at equivalent stages were stained with phalloidin to label actin and this is shown in red. (C) Quantification of the intensity of Tpm3 immunostaining in the region of cortical actin. Tpm3 was stained using the monoclonal antibody CG3. The cortical localization of Tpm3 was quantitated using ImageJ and is expressed as the mean grayscale value of this fluorescence staining. Box range represents the SEM, whiskers represent the standard error, and the line inside the box represents the mean. Statistical difference was assessed by an ANOVA followed by Tukey post-hoc test. *P < 0.05; **P < 0.01; N.S., not significant.

An official website of the United States government
Here's how you know
Official websites use .gov
A
.gov website belongs to an official
government organization in the United States.
Secure .gov websites use HTTPS
A lock (
) or https:// means you've safely
connected to the .gov website. Share sensitive
information only on official, secure websites.
