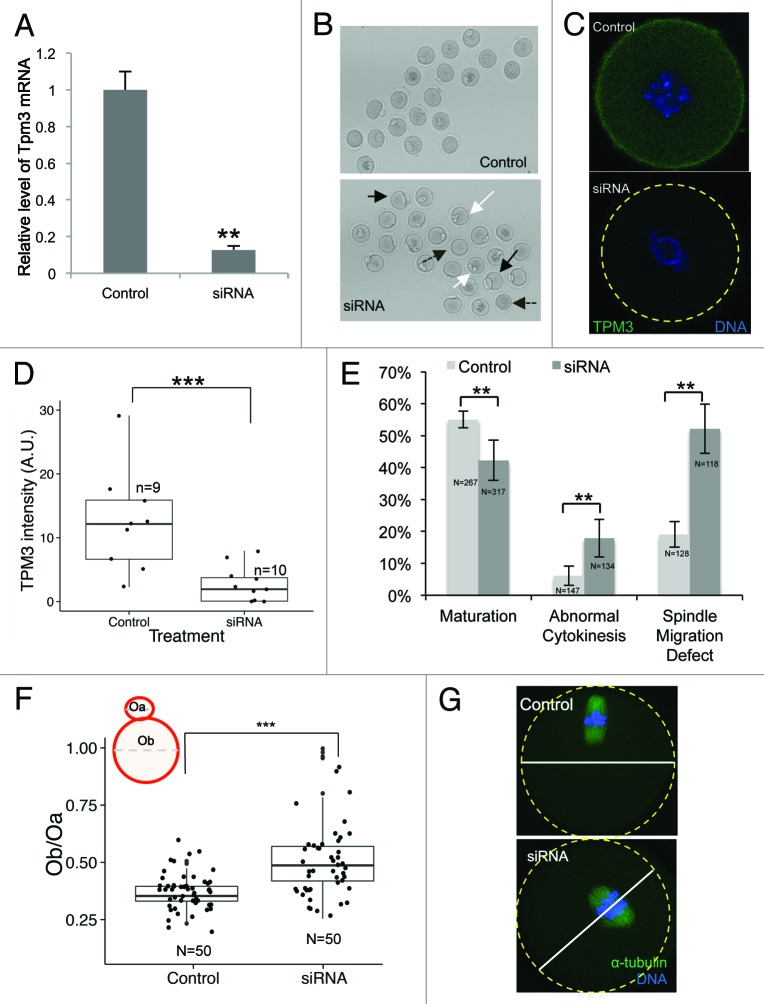
Figure 2. Knockdown of Tpm3 impairs asymmetric division of mouse oocytes. (A) The RNA level of Tpm3 in Tpm3-targeting small interfering RNA (siRNA)-injected oocytes (siRNA) is shown as the fraction of that in control siRNA-injected oocytes (control). (B) Morphology of Tpm3-targeting siRNA- or control siRNA-injected oocytes after 12 h of incubation. A large polar body (black arrow), multiple polar bodies (white arrow), and oocytes that did not form a polar body (dashed black arrow) are indicated. (C) Tpm3 immunostaining of control siRNA- (top) and Tpm-targeting siRNA-injected (bottom) oocytes. Green, Tpm3; blue, DNA. (D) Quantification of the level of cortical Tpm3 in Tpm3-targeting siRNA- and control siRNA-injected oocytes at 8 h after injection. The box range represents the standard error of the mean, whiskers represent the standard error, and the line inside the box represents the mean. Statistical significance was assessed using an ANOVA followed by Tukey post-hoc test. ***P < 0.005 (E) Percentage of MII oocytes that matured. Abnormal MII oocytes and spindle migration defects following injection of Tpm3-targeting siRNA (dark gray) or control siRNA (light gray). MII oocytes with a large polar body (diameter of the polar body larger than 50% of that of the oocyte) or a 2-cell-like morphology were considered to be abnormal. All experiments were repeated at least 3 times and involved at least 30 oocytes. The percentage of oocytes in which spindle migration was abnormal after 9.5 h of incubation is shown (n = 128 and 118 for control and Tpm3-knockdown oocytes, respectively). Statistical significance was assessed using the χ2 test with a confidence interval of 95%. (F) Distribution of the ratio of the diameter of the polar body to the diameter of the oocyte in control siRNA- and Tpm3-targeting siRNA-injected oocytes. The box range represents the standard error of the mean, whiskers represent the standard error, and the line inside the box represents the mean. The statistical significance of the difference in oocyte/polar body diameter between control and Tpm3-knockdown oocytes was assessed using Welch 2-samples t test. ***P < 0.005 (G) Spindle location after 9.5 h of incubation. Green, α-tubulin; blue, DNA.

An official website of the United States government
Here's how you know
Official websites use .gov
A
.gov website belongs to an official
government organization in the United States.
Secure .gov websites use HTTPS
A lock (
) or https:// means you've safely
connected to the .gov website. Share sensitive
information only on official, secure websites.
