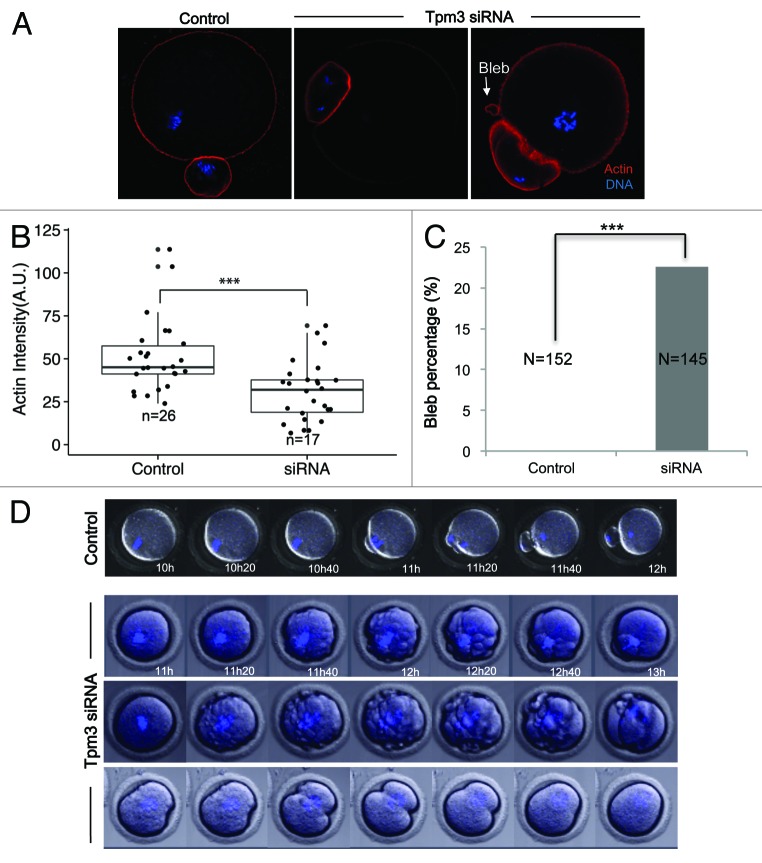
Figure 3. Knockdown of Tpm3 decreases the level of cortical actin and causes membrane blebbing. (A) Phalloidin staining of cortical actin in control small interfering RNA (siRNA)- and Tpm3-targeting siRNA-injected oocytes. Red, actin; blue, DNA. Arrow indicates blebs formed in Tpm3-targeting siRNA-injected oocytes. (B) Quantification of the amount of actin in each oocyte. The fluorescence intensity of phalloidin in the cortex of control and Tpm3-knockdown oocytes (n = 26) was measured using ImageJ and the mean value is provided. The box range represents the standard error of the mean, the whiskers represent the standard error, and the line inside the box represents the mean. Statistical significance was assessed using Welch 2-sample t test with a confidence interval of 95%. (C) Percentage of oocytes that exhibit membrane blebbing (n = 152 and 145 for control and Tpm3-knockdown oocytes, respectively). Statistical significance was assessed using the χ2 test with a confidence interval of 95%. (D) Time-lapse microscopy of maturing Tpm3-knockdown oocytes. DNA was stained with Hoechst 33342 (blue). Control: control siRNA-injected oocyte. The control oocyte extruded a polar body after 11–12 h of incubation (also see Video S1). Tpm3-targeting siRNA: 3 representative oocytes are shown. In the top panel, numerous blebs are formed just before cytokinesis and then the polar body is extruded (also see Video S2). In the middle panel, the oocyte has blebs and divides symmetrically (also see Video S3). In the bottom panel, the oocyte divides symmetrically, but fails to finish cytokinesis (also see Video S4).

An official website of the United States government
Here's how you know
Official websites use .gov
A
.gov website belongs to an official
government organization in the United States.
Secure .gov websites use HTTPS
A lock (
) or https:// means you've safely
connected to the .gov website. Share sensitive
information only on official, secure websites.
