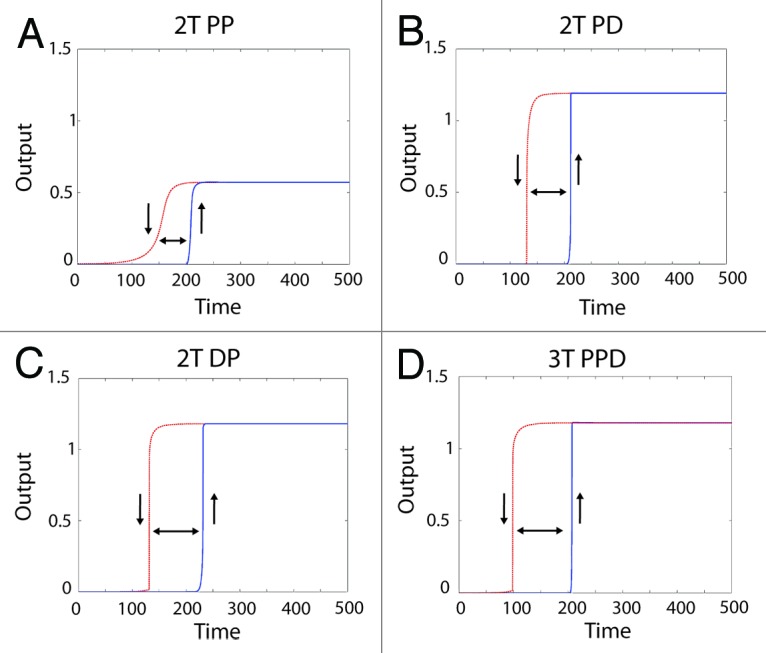
Figure 4. Generating a digital output from different MAPK module topologies using a positive feedback loop. Shown are the system outputs of the 4 most robust module configurations in the presence of a positive feedback loop. The blue solid curve shows the system being activated, with the upward pointing arrow indicating “switching on”. The red dashed line indicates the system becoming inactive after the input is removed, with a downward pointing arrow indicating 'switching off'. The double-headed arrow between the curves shows the presence of hysteresis, which combined with the sharp transition between “off” and “on” states indicates a bistable system output. The module configuration is indicated above each panel with a heading in bold.
