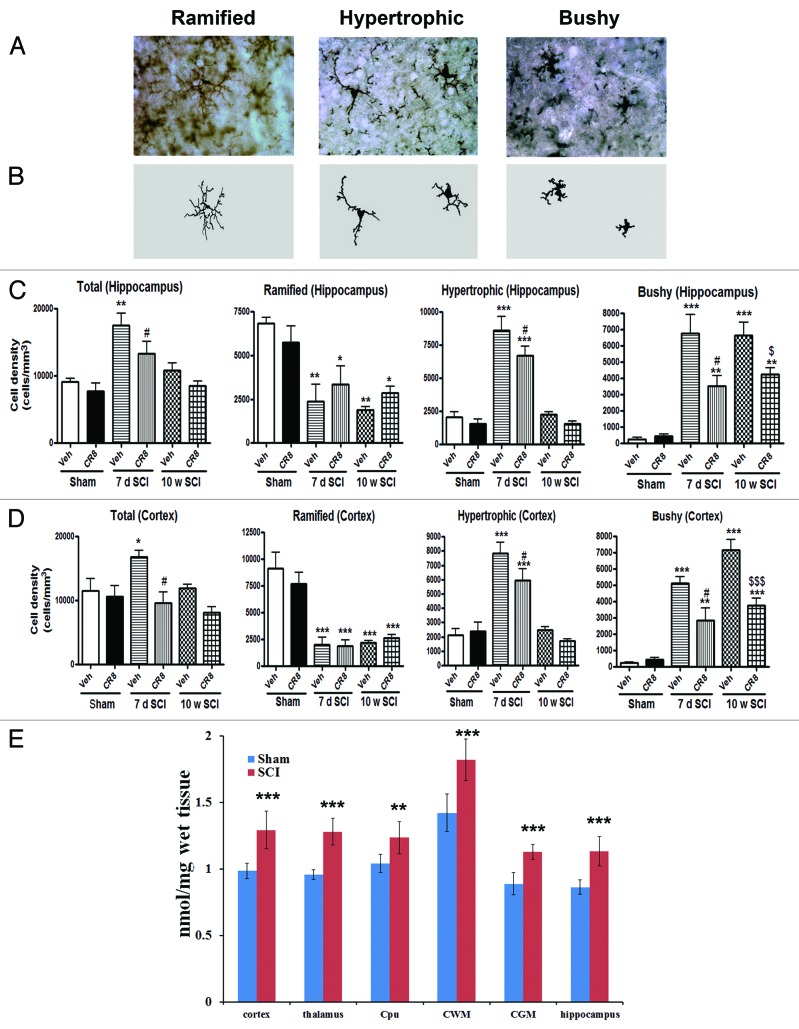
Figure 2. SCI increases activated microglial phenotypes in the brain at 7 d and 10 wk post-lesion. (A and B) Representative Iba-1 immunohistochemical images displaying resting (rami□ed morphology) or activated (hypertrophic or bushy morphology) microglial phenotypes and the corresponding Neurolucida reconstructions. (C and D) Unbiased stereological quantitative assessment in the hippocampus (C) and cerebral cortex (D) revealed increased numbers of highly activated microglia displaying a hypertrophic and bushy cellular morphology and reduced numbers of resting microglia displaying the ramified cellular morphology in SCI-brain when compared with Sham/Vehicle rats. CR8 treatment reversed these changes. *P < 0.05, **P < 0.01, ***P < 0.001, SCI/Vehicle vs. Sham/Vehicle groups; #P < 0.05, 7d SCI/CR8 vs. 7d SCI/Vehicle groups. $P < 0.05, $$$P < 0.001, 10w SCI/CR8 vs. 10w SCI/Vehicle groups. n = 4 (Sham/Vehicle), 5 (Sham/CR8), 4 (7d SCI/Vehicle), 6 (7d SCI/CR8), 5 (10w SCI/Vehicle), and 5 (10w SCI/CR8). (E) In vitro [125I]iodo-DPA-713 autoradiography in rat brain sections at 7 d post-SCI. All rats were sacrificed 7 d after sham or injury. Their brains were collected, sectioned on a cryomicrotome, and then probed with the indicated radiotracer. Blue bars indicate regional binding of [125I]iodo-DPA-713 in nmol/mg of wet tissue for sham treated rats while red bars indicate tracer binding in injured rats. Radioracer binding in injured rats was significantly higher across all measured regions as compared with sham-treated rats. To determine the extent of TSPO radiotracer differences, a two-tailed t test was performed. *P < 0.05; **P < 0.005; ***P < 0.0005 vs. Sham group. n = 5 for both groups. Cpu = caudate/putamen; CWM = cerebellar white matter; CGM = cerebellar gray matter.

An official website of the United States government
Here's how you know
Official websites use .gov
A
.gov website belongs to an official
government organization in the United States.
Secure .gov websites use HTTPS
A lock (
) or https:// means you've safely
connected to the .gov website. Share sensitive
information only on official, secure websites.
