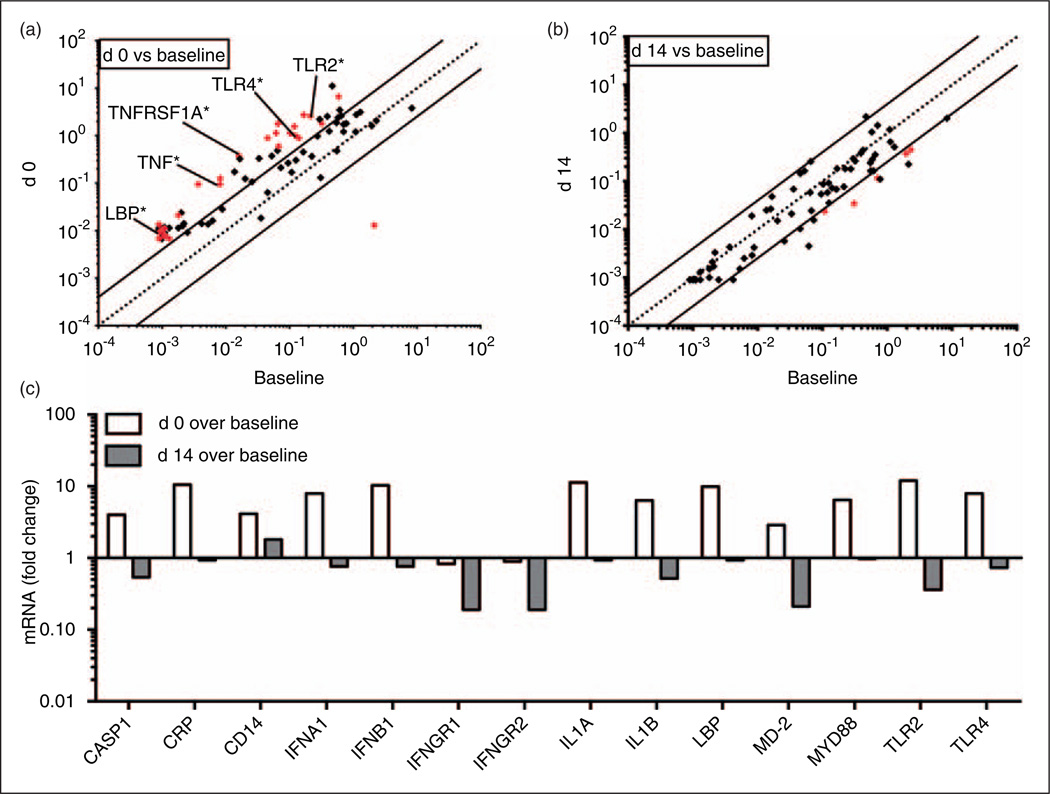
Figure 2.
Changes in mRNA levels of selected inflammatory genes following onset of endotoxemia in myelo-ablative HCT. Cohort I: peripheral blood samples from patients undergoing HCT were collected at baseline (B—before myelo-ablative conditioning), d 0 (day of transplant) and d 14, and mRNA extracted and analyzed for selected inflammatory markers. Fold changes of mRNA levels over B (x-axis) on (a) d 0 (y-axis) and (b) d 14 (y-axis) are shown. (c) Differential regulation over B comparing d 0 and d 14 (from a and b) are shown as bar graphs for a selection of genes. Statistical significance comparing B to either d 0 or d 14 was assessed by Student’s t-test of the replicate 2−∆Ct values for each gene compared with baseline. Fold changes greater than fourfold were considered meaningful and statistically significant changes are shown in red for each individual gene (Supplementary Table S4).

