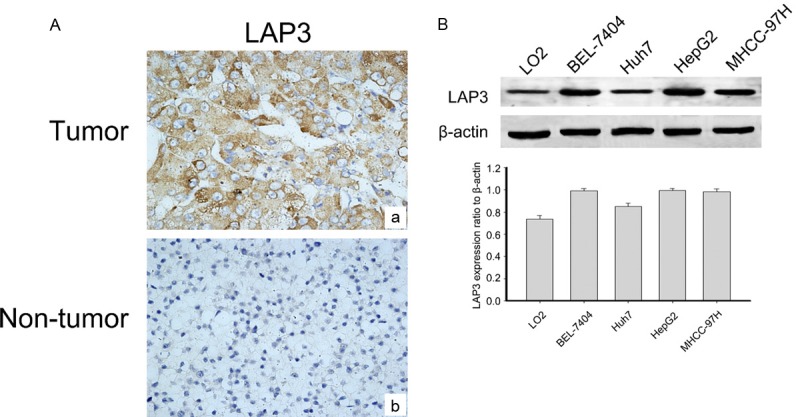
Figure 1.

LAP3 is expressed in HCC tissues and cells. A. Representative images of LAP3 immunohistochemical staining in a tissue microarray that contains containing 115 HCC samples and 15 normal liver samples, Scale bar: 50 μm. B. Western blot analysis shows that LAP3 protein expression is increased in HCC cells compared with the normal liver cell lines (LO2). GAPDH was used as a loading control. The bar chart demonstrates the ratio of LAP3 protein to GAPDH by densitometry. The data are means ± SEM.
