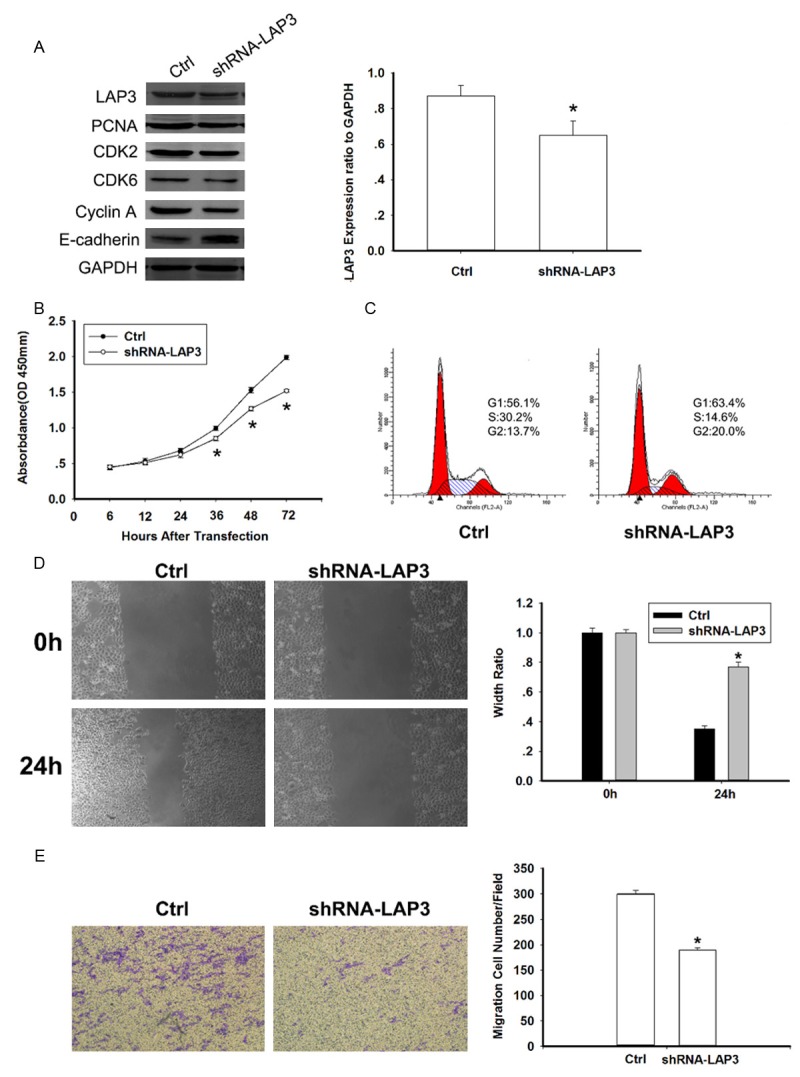
Figure 3.

Knockdown of LAP3 inhibited HepG2 cells viability and migration in vitro. A. Western blot analysis of LAP3, PCNA, CDK2, CDK6, Cyclin A, E-cadherin, GAPDH (loading control) in control and shRNA-LAP3 HepG2 cells. The bar chart showed LAP3 expression ratio to GAPDH. The data are mean ± SEM (n = 3, *P<0.01, compared with control). B. Effect of LAP3 knock-down on proliferation of HepG2 cells, analyzed by the cell viability assay. Data are representative of three independent experiments. *P<0.05. C. Knockdown of LAP3 could restrain G1/S transition in HepG2 cells. The cell cycle distribution of HepG2 cells detected by flow cytometric analysis. D. Wound healing assays with negative control and shRNA-LAP3 HepG2 cells. Migration of the cells to the wound was visualized at 0, 48 h with an inverted Leica phase-contrast microscope. The bar chart showed the relative migration distance of cells. The data are mean ± SEM (n = 3, *P<0.05, compared with 0 h). E. Knockdown of LAP3 suppressed cell migration by transwell assays. For transwell assays, control and shRNA-LAP3 HepG2 cells were seeded into the upper chamber of the transwell and the cells that migrated through the pores to the lower surface of the filter were counted in 10 fields under 20× objective lens. The bar chart showed the percentage of migrant cells. The data are mean ± SEM (n = 3, *P<0.01, compared with control).
