
Figure 3.
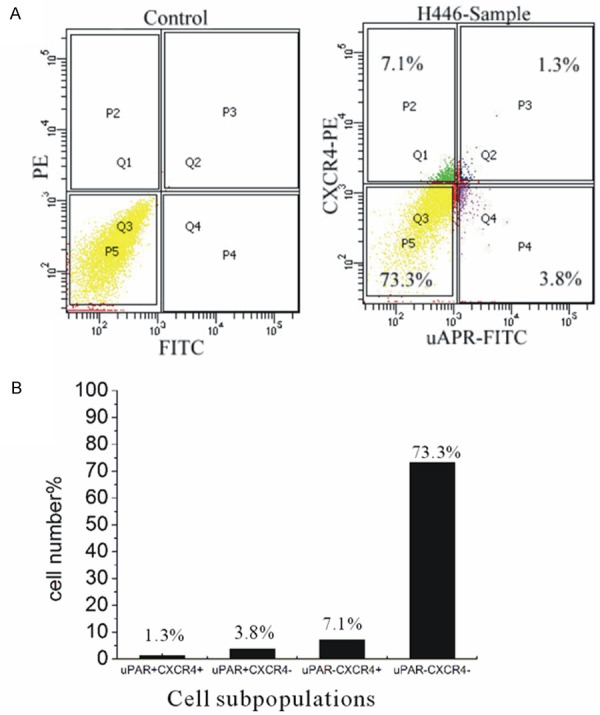
FACS analysis of H446 cell line double-labeled with uPAR-FITC and CXCR4-PE, antibody. A: H446 cells staining mouse IgG as isotype control analyzed by FACS (left). H446 cell line double-labeled with uPAR-FITC and CXCR4-PE antibody analyzed by FACS (right). B: The proportion of uPAR+CXCR4+ (1.3%), uPAR+CXCR4- (3.8%), uPAR-CXCR4+ (7.1%) and uPAR-CXCR4- (73.3%) four subpopulations in H446.