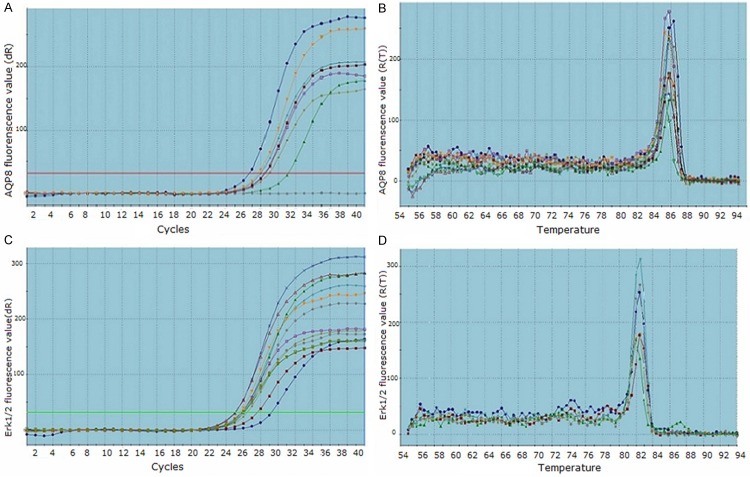
Figure 1.
Amplification plots and dissociation curves by RT-PCR. (A) Amplification plot for AQP8 gene, (B) Dissociation curve for AQP8 gene; (C) Amplification plot for Erk1/2 gene, (D) Dissociation curve for Erk1/2 gene. X axis of amplification plots: cycles, Y axis of amplification plots: fluorescence value; X axis of dissociation curves: temperature, Y axis of dissociation curves: fluorescence value.

