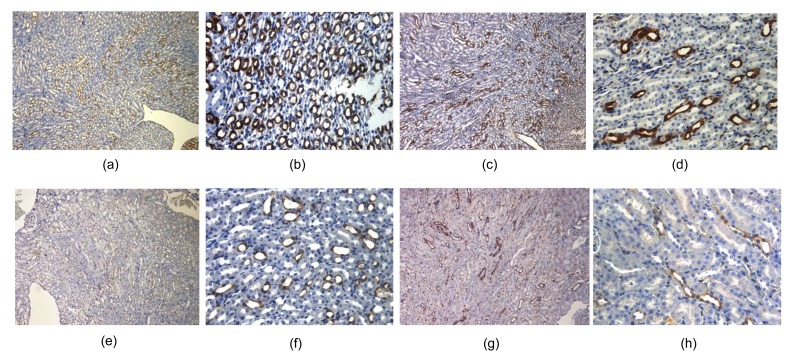
Fig. 4.
Immunohistochemical analyses of COX-1 and COX-2
(a, b) IRI group had the COX-1 staining (++–+++) in the renal tubes, and the number of positive cells >50%; (c, d) IRI group had the COX-2 staining (++–+++) in the renal tubes, and the number of positive cells >50%; (e, f) 5 mg/kg IMT treatment group had the COX-1 staining (+) in the renal tubes, and the number of positive cells <25%; (g, h) 5 mg/kg IMT treatment group had the COX-2 staining (+) in the renal tubes, and the number of positive cells <25%. (a, c, e, g) Magnification 10×; (b, d, f, h) Magnification 40×

