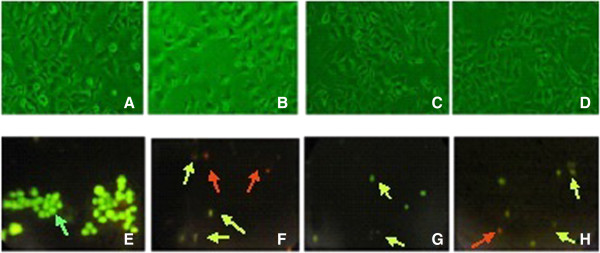
Figure 3.

Light micrographs of HEp-2 cell line after 24 hours of incubation with the AEFL at different concentrations. Cells treated A-negative Control; B-Positive Control (Camptothecin); C- 100 μg/mL; D - 300 μg/mL. Live cells have definite morphology and dead cell are rounded. Reduction in cell density also observed in positive control and the AEFL treated cells. Acridine orange-ethidium bromide (AO/EB) fluorescent staining detection of apoptotic morphology in Hep2 cells treated with the AEFL at different concentrations are depicted in the bottom row. E-negative control; F- Camptothecin as the positive control (5 mM; 25 μL); G- 400 μg/mL, H - 800 μg/mL. This figure represents the results of at least 3 independent experiments. Green arrows: live cells, greenish yellow: apoptotic cells (some cells are fragmented and faded color), orange red: late apoptotic cells. (Original magnification 40×).
