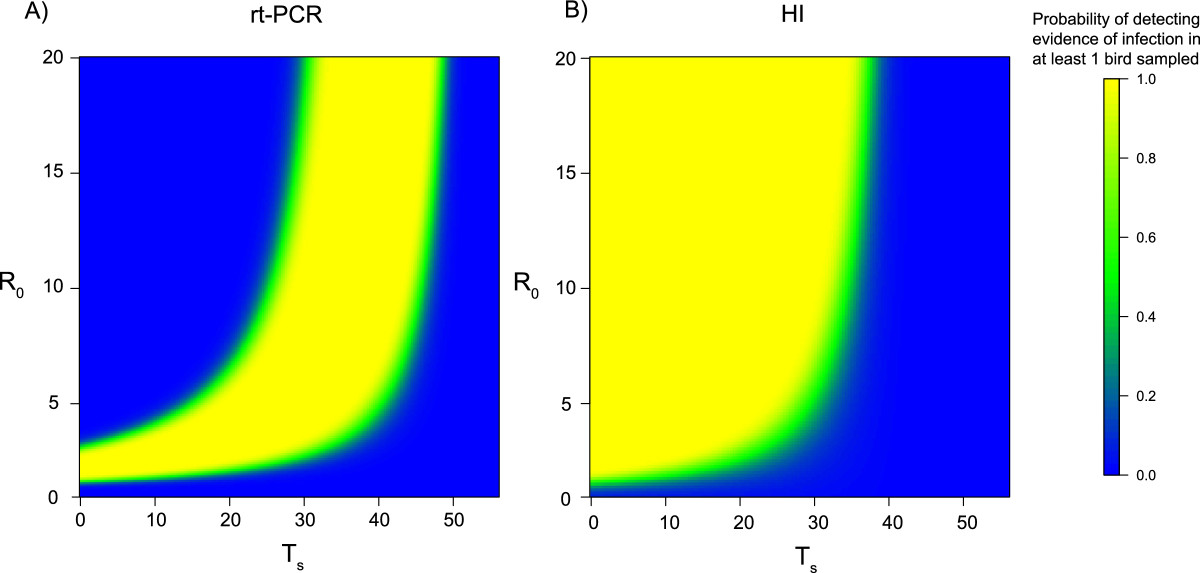
Figure 2.

The probability of detecting evidence of infection at time of slaughter with different basic reproduction numbers ( R 0 ) and days of virus introduction T s . A) The probability of detecting at least 1 infected bird at time of slaughter (day 56) using an rt-PCR test, when 1% of the flock is sampled. B) The probability of detecting at least 1 infected bird at time of slaughter (day 56) using an HI assay, when 1% of the flock is sampled. For both panels, as the probability approaches 1 the greater the chance there is of detecting evidence of infection (yellow). As the probability approaches 0 there is no chance of detecting evidence of infection (blue).
