Figure 1.

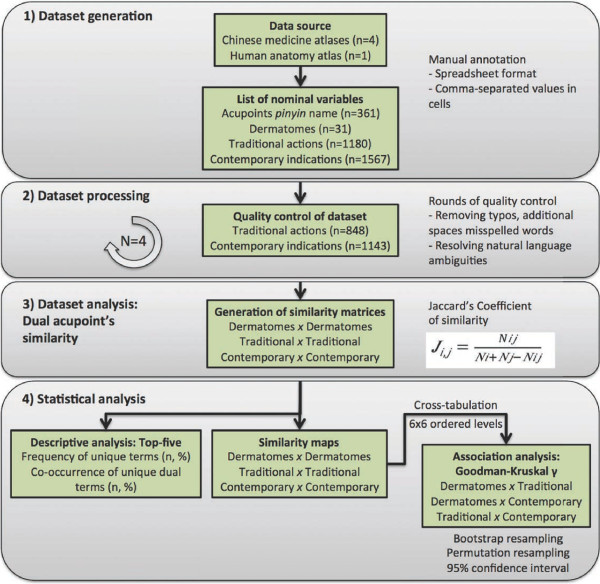
Flowchart of the study. The flow chart of the study was divided into stages: dataset generation, dataset quality control, computation of dual acupoint’s similarity, and statistical analysis.

Flowchart of the study. The flow chart of the study was divided into stages: dataset generation, dataset quality control, computation of dual acupoint’s similarity, and statistical analysis.