
Table 3.
Comparison of 24-hr urine constituents between SF with normal renal function and SF with renal insufficiency
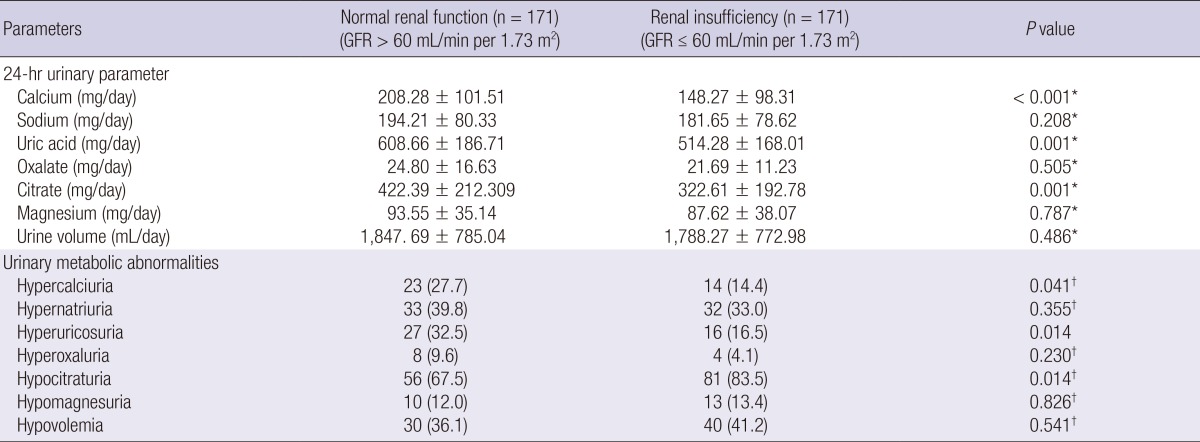
P values are based on the *Mann-Whitney U-test and †Fisher's exact test.
Official websites use .gov
A
.gov website belongs to an official
government organization in the United States.
Secure .gov websites use HTTPS
A lock (
) or https:// means you've safely
connected to the .gov website. Share sensitive
information only on official, secure websites.
Comparison of 24-hr urine constituents between SF with normal renal function and SF with renal insufficiency
P values are based on the *Mann-Whitney U-test and †Fisher's exact test.