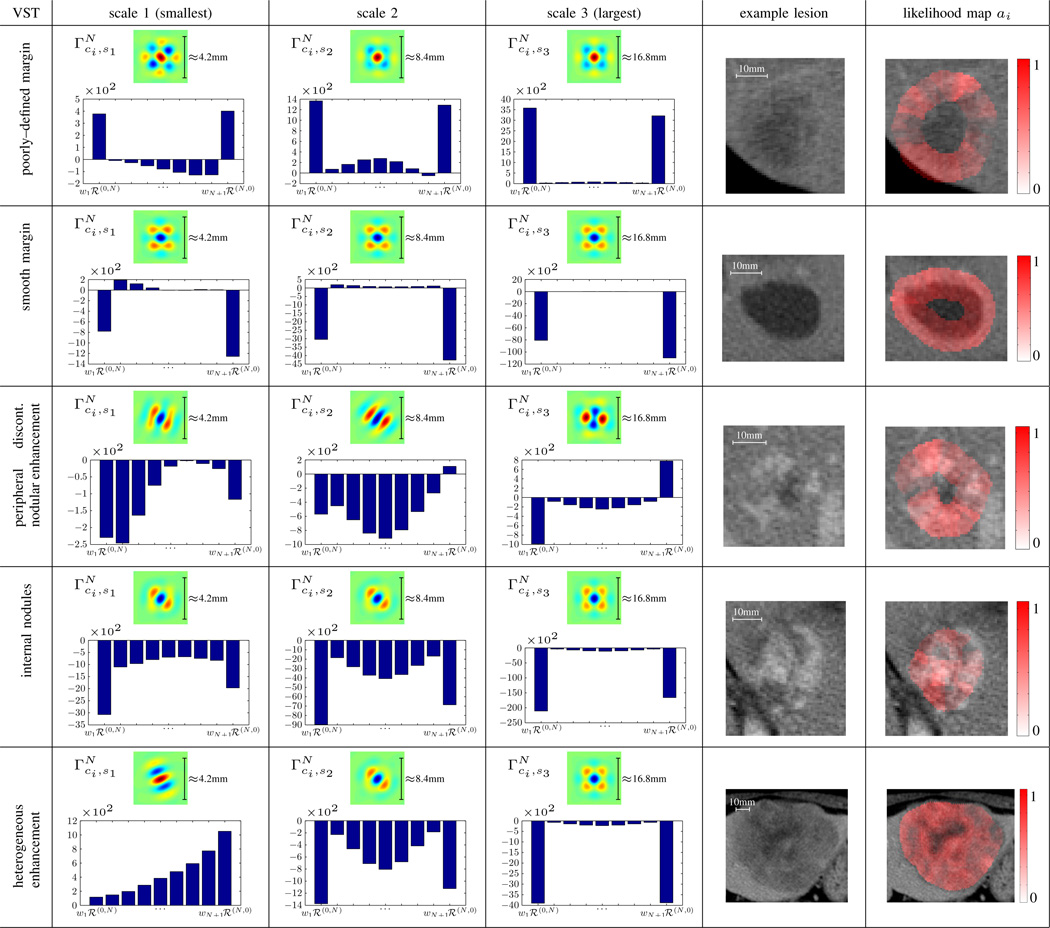
Fig. 5.
Scale–wise models for 5 VSTs and N = 8. The distributions of the weights wci,j learned by OVA SVMs are represented for each scale with bar plots. The red regions in the last column of the table are showing examples of likelihood maps ai computed from Eq. (8) for every VSTs.

