Fig. 1.

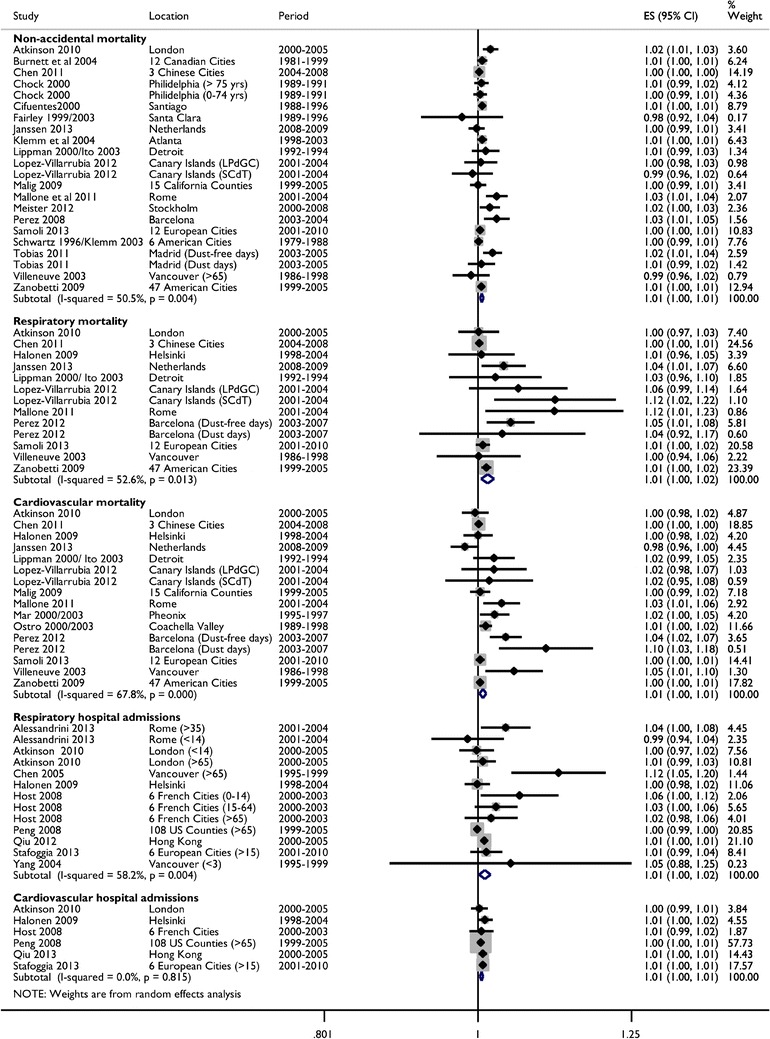
Forest plot of incidence rate ratios for mortality and hospital admissions per 10 μg/m3 of short-term exposure to PM10-2.5. Note: Overall estimates are from random-effects models without adjustment for possible publication bias

Forest plot of incidence rate ratios for mortality and hospital admissions per 10 μg/m3 of short-term exposure to PM10-2.5. Note: Overall estimates are from random-effects models without adjustment for possible publication bias