
Table 4.
Expected versus actual nurses' behavior to pro re nata administration
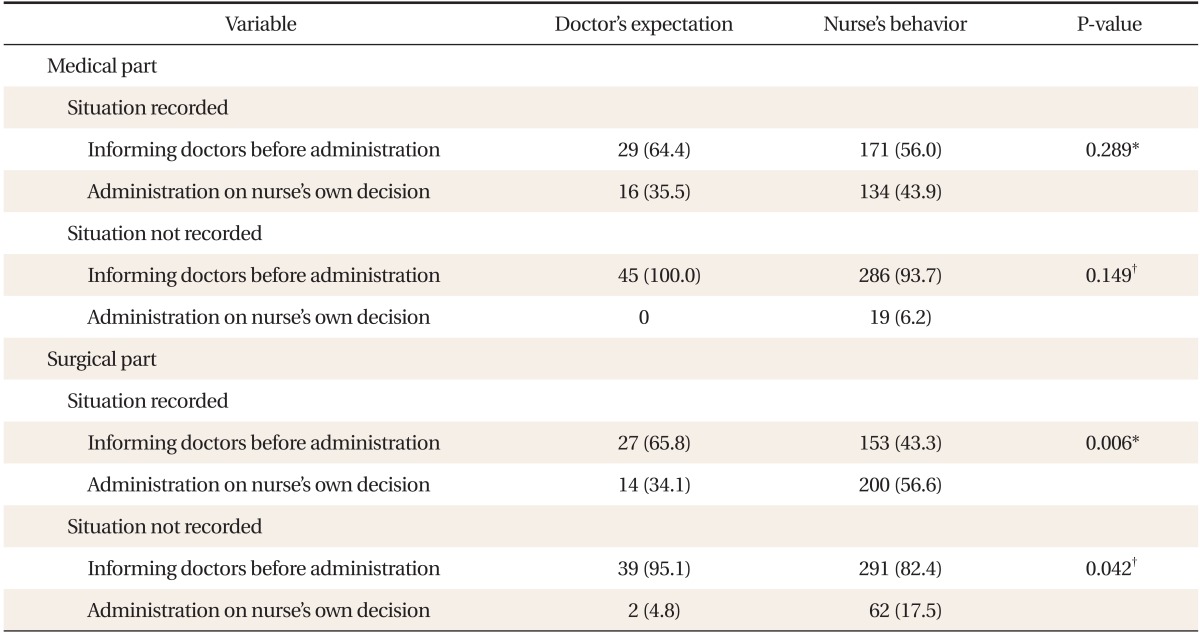
Values are presented as number (%).
*By chi-square test. †By Fisher's exact test.
Official websites use .gov
A
.gov website belongs to an official
government organization in the United States.
Secure .gov websites use HTTPS
A lock (
) or https:// means you've safely
connected to the .gov website. Share sensitive
information only on official, secure websites.
Expected versus actual nurses' behavior to pro re nata administration
Values are presented as number (%).
*By chi-square test. †By Fisher's exact test.