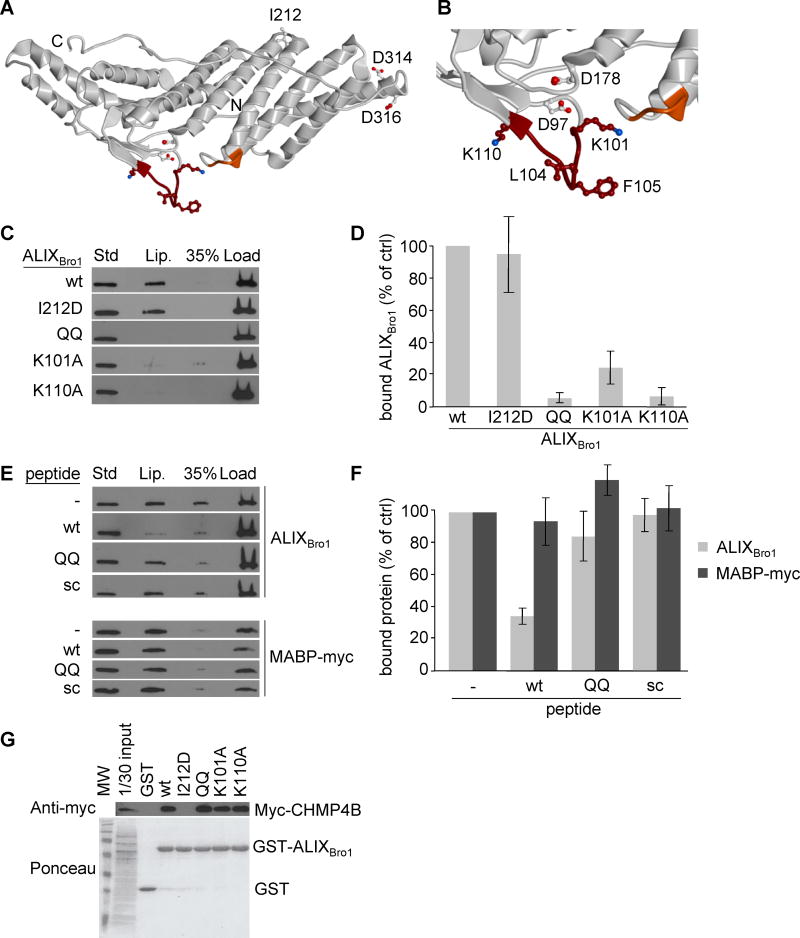
Figure 2. Identification of the membrane interaction site of ALIXBro1.
(A) Ribbon model of ALIXBro1 using the atomic coordinates derived from the X-ray diffraction analysis (PDB ID: 2R03) (Zhai et al., 2008). The N- and C-termini of the Bro1 domain are marked with N and C, respectively. The membrane interacting residues predicted by MODA are shown in brown (101-KGSLFGGSVK-110) and orange (232-QYKD-235). Side chains of residues mutagenized in this study are indicated as sticks, including i) I212 involved in CHMP4 interactions (Fisher et al., 2007; Usami et al., 2007), ii) L104, F105, K101 and K110 in membrane binding, iii) D97 and D178 in calcium coordination, and iv) D314 and D316 as controls. (B) Higher magnification view of the membrane-interacting region. (C) The liposome-binding capacity of ALIXBro1, ALIXBro1I212D, ALIXBro1QQ, ALIXBro1K101A and ALIXBro1K110A was analyzed as in Fig 1B. (D) Data in (C) were quantified and are expressed as a percentage of the wt values. (E) ALIXBro1 or the myc-tagged MABP domain of MVB12B was incubated with liposomes containing 20% LBPA or PS, respectively, in the presence of 100-fold molar excess wt, QQ or scrambled peptide. Membrane binding of ALIXBro1 was analyzed as in Fig 1B. (F) Data in (E) were quantified and are expressed as a percentage of a control without peptide. (G) Extracts prepared from cells expressing CHMP4B-myc were incubated with ALIXBro1-GST or with the same mutants as in (C-D). These were then retrieved using glutathione Sepharose beads and analyzed by western blotting using anti-myc antibody. First lane: 1/30 of the starting materials. All quantifications show means (±SEM) of at least 3 independent experiments (see also Fig S2).

