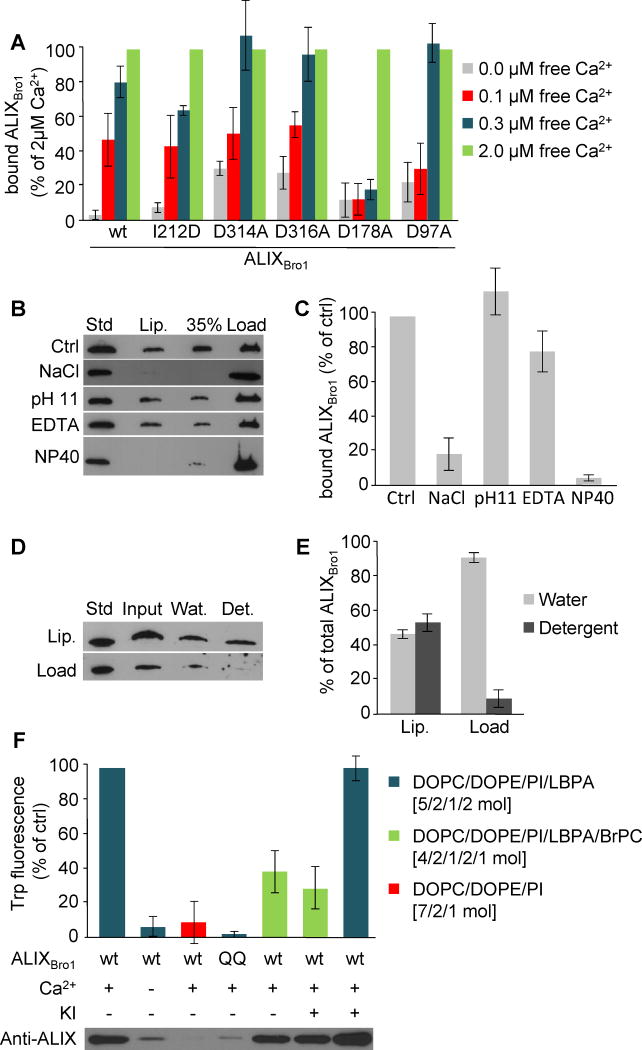
Figure 3. Characterization of ALIX-membrane interactions.
(A) Liposome binding was analyzed as in Fig 1B for ALIXBro1, ALIXBro1I212D, ALIXBro1D97A, ALIXBro1D178A, ALIXBro1D314A and ALIXBro1D316A in the presence of 0., 0.1, 0.3 and 2μM free calcium. Binding is expressed as a percentage of the value obtained with 2μM free calcium. (B) ALIXBro1 was first pre-incubated with liposomes for 2h as in Fig 1B. The reaction mixture was then adjusted to 2M NaCl, 0.1M carbonate pH 11, 10mM EDTA or 2% NP40. ALIXBro1 remaining on the membrane was analyzed after floatation as in Fig 1B. (C) Quantification of membrane-bound ALIXBro1 in (B). Binding is expressed as a percentage of the control (Ctrl). (D) After binding to liposomes, membrane-bound and free ALIXBro1 were separated as in Fig 1B, and each was extracted with TX-114. Lanes 1–4: 0.25μg ALIXBro1 as standard; complete mixture before phase separation (input); water (Wat) and detergent (Det) phases after extraction. (E) Quantification of TX-114 extraction in (D), expressed as a percentage of the total protein in each condition. (F) Recombinant ALIXBro1 and ALIXBro1QQ were incubated in the presence or absence of 2.5μM calcium and liposomes lacking LBPA or containing 20mol% LBPA with or without 10% BrPC. Liposomes with membrane-bound protein were recovered by floatation and Trp fluorescence was measured. If indicated, 150 mM KI was added prior to the measurements. All quantifications show means (±SEM) of 3 independent experiments (see also Fig S3).

