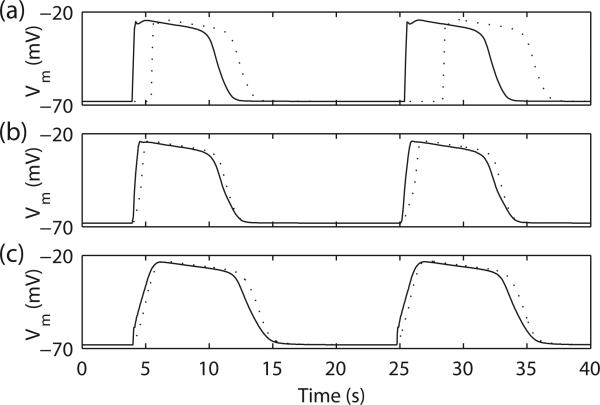
Fig. 3.
Simulated 1D slow wave entrainment. (a) In the decoupled model (by setting σe and σi to 0.001 mS mm–1), the simulated slow waves on the two boundary nodes demonstrated different intrinsic frequencies, 3.00 cpm (solid line) and 2.68 cpm (dashed line). In the entrained model, (b) IP3-dependent Ca2+-release model and (c) IPU model, the slow wave with the lower intrinsic frequency (dashed line) was entrained to the slow wave with the higher intrinsic frequency (solid line).

