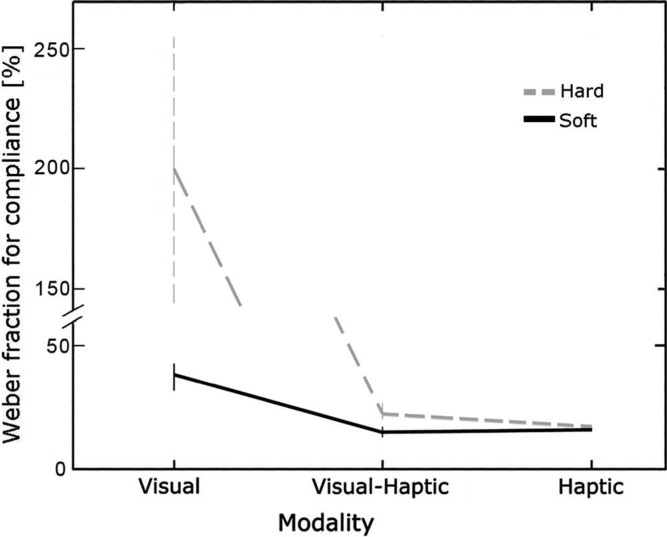
Figure 4.
Average JND reported as percentage of the standards' compliance values (average Weber fraction) for each modality and compliance set condition. Error bars represent standard errors of the mean (SEM). The y axis, as well the dotted gray line, is cutted in order to give a better rendering of the data.

