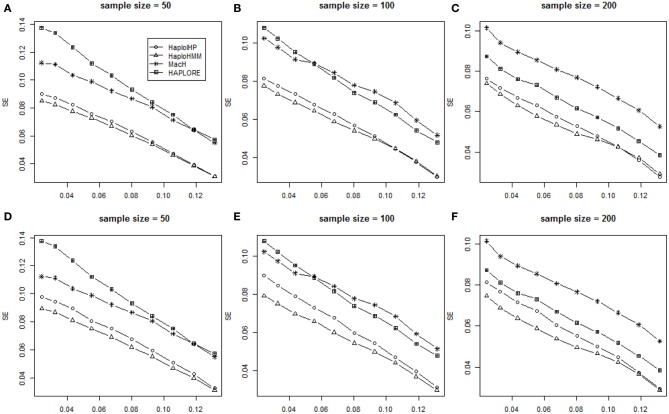
Figure 3.
Average values of SE with the sample size of 50, 100, and 200 and the assumption of HWE under different haplotype frequency distributions. The x-axis represents the standard deviation of haplotype frequencies used in simulations. (A–C) represent the results when no incorrect haplotypes were included as identified haplotypes while (D–F) represent the results when some incorrect haplotypes were included as identified haplotypes.

