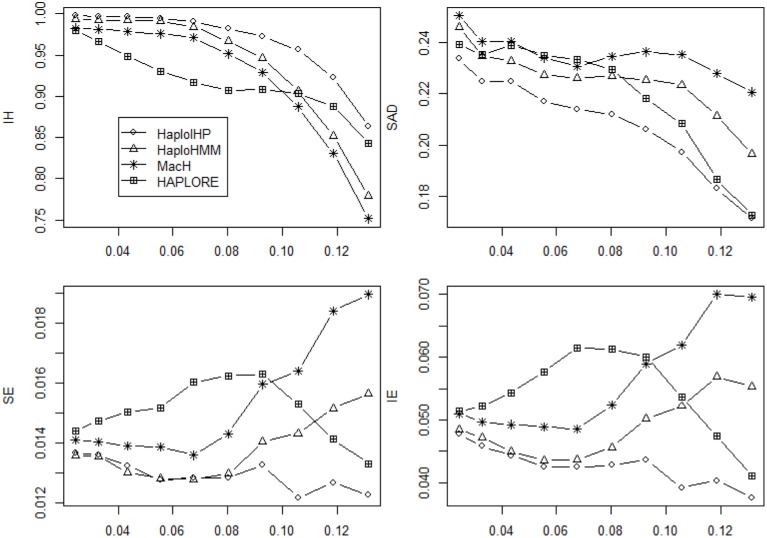
Figure 5.
Average values of six measures (IH, SAD, SE, and IE) over 500 replicates with the sample size of 100 and the assumption of HWE under different haplotype frequency distributions. The x-axis represents the standard deviation of haplotype frequencies used in simulations. Results were obtained when there was no missing data and there was no incorrect haplotypes included as identified haplotypes.

