
Figure 2.
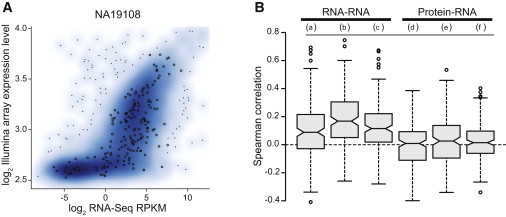
Relationship between Transcript and Protein Levels
(A) Correlation between Illumina array and RNA-seq expression measurements within individuals. Log2-transformed expression estimates derived from the array are plotted with a smoothed density against log2-transformed RPKMs derived from RNA-seq. Explicit circles denote genes with corresponding protein-level quantifications.
(B) Boxplots of Spearman correlation coefficients between RNA-sequencing, Affymetrix exon array probe sets, Illumina expression array probe sets, and antibodies targeted to the same gene for all 68 individuals. The boxplots are labeled as follows: (a) RNA-seq versus exon arrays, (b) exon arrays versus expression arrays, (c) RNA-seq versus expression arrays, (d) protein versus expression arrays, (e) protein versus exon arrays, and (f) protein versus RNA-seq.