
Figure 2.
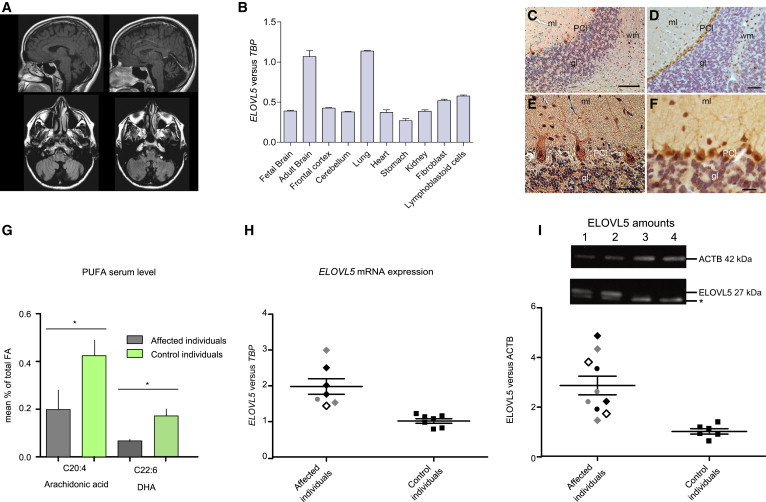
MRI Scans, ELOVL5 Expression, ELOVL5 Localization, and PUFA Serum Levels
(A) MRI scans of an affected individual (III-10 in family SCA38-01-BS). Coronal, midsagittal, and horizontal sections are reported. Cerebellar atrophy with vermis involvement is shown; the cortex and brainstem are preserved.
(B) The normal expression pattern of ELOVL5 in five human tissues, lymphoblastoid cells, and four brain areas (mean ± SD). ELOVL5 showed prominent expression in brain and lung. Gene expression was measured by quantitative PCR with FAM-labeled Universal ProbeLibrary LNA probes (Roche Diagnostics) (Table S6).
(C–F) Micrographs of sections of healthy human (C and E) and murine (D and F) cerebellar cortex immunostained with ELOVL5 antibody. Human cerebellar sections were obtained from paraffin-embedded tissues of postmortem brain derived from a healthy subject. Sections were incubated with ELOVL5 polyclonal antibody (C15621, diluted 1:400, AssaybIoTech) and counterstained with hematoxylin. Higher magnifications of sections of human and mouse cerebellar cortex are shown in (E) and (F), respectively. Note the similar labeling pattern of human and mouse Purkinje cells and the presence of numerous labeled cells in the white matter. Abbreviations are as follows: ml, molecular layer; PCl, Purkinje cell layer; gl, granular layer; and wm, white matter. Scale bars represent 200 μm (C), 80 μm (D), 50 μm (E), and 20 μm (F).
(G) Fatty-acid analysis in serum isolated from whole blood of four affected individuals (III-10 in family SCA38-01-BS, IV-8 and IV-9 in family SCA38-02-CA, and III-3 in family SCA38-03-TO). Fatty acids were analyzed in the serum from affected and control individuals by liquid chromatography-tandem mass spectrometry.15 Reduced AA and DHA were measured in affected individuals (mean ± SEM; AA, ∗p < 0.05; DHA,∗p < 0.05). Statistical analysis was performed with a one-tailed unpaired t test.
(H) Quantitative real-time PCR on the affected individuals’ cDNA showed an increase in ELOVL5 expression in comparison to the TBP reference (mean ± SEM; ∗∗∗p < 0.001, Mann Whitney test; ∗∗p < 0.01, two-tailed unpaired t test, Welch’s correction).
(I) ELOVL5 showed higher amounts in comparison to β-actin (ACTB) (mean ± SEM; ∗∗∗p < 0.001, Mann Whitney test; ∗∗p < 0.01, two-tailed unpaired t test, Welch’s correction). Total proteins were extracted from lymphoblasts of five affected individuals (III-6 and III-10 in family SCA38-01-BS and IV-8, IV-9, and IV-12 in family SCA38-02-CA) and five age- and origin-matched healthy controls. ELOVL5 amounts were normalized to ACTB. Different symbols indicate different affected individuals. The asterisk indicates an uncharacterized immunoblot signal as demonstrated in Elovl5-knockout mice (see Figure S3A). Lanes 1 and 2 are affected individuals IV-8 and IV-9, respectively, of family SCA38-02-CA; lanes 3 and 4 are two healthy controls.