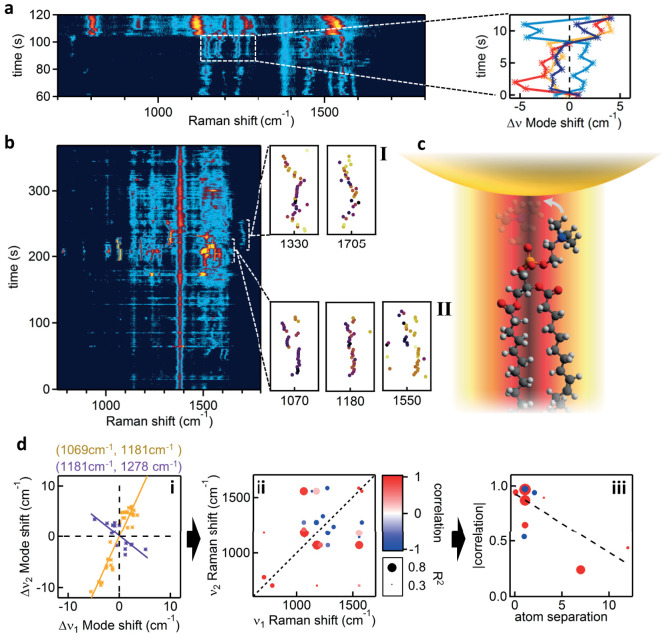
Figure 3. Fast dynamics of hybrid lipid-bilayer (POPC:DOTAP) SERS.
(a), Time dependent evolution of SERS from a single gold NPoM. Trajectories of individual lines show dramatic jumps and correlated shifts, corresponding to lipid dynamics within the gap plasmon volume. Right: Selected short-time dynamics highlighting the (anti-)/correlations between Raman lines. (b), Raman trajectory, including flexing events labelled I, II extracted to right. (c), Schematic lipid flexing within gap plasmon hot spot. (d), i, Frequency shifts at each time step of Raman line pairs (ν1, ν2) showing positive (orange) and negative (purple) correlations. ii, Strength of correlation between pairs of Raman lines (ν1, ν2) with size of points giving correlation strength R2. iii, Magnitude of correlation (as in ii) when separation between bonds involved increases (dashed linear fit has R2>0.5). All spectra acquired at λR = 633 nm with acquisition time of 1 s.

