
Figure 3.
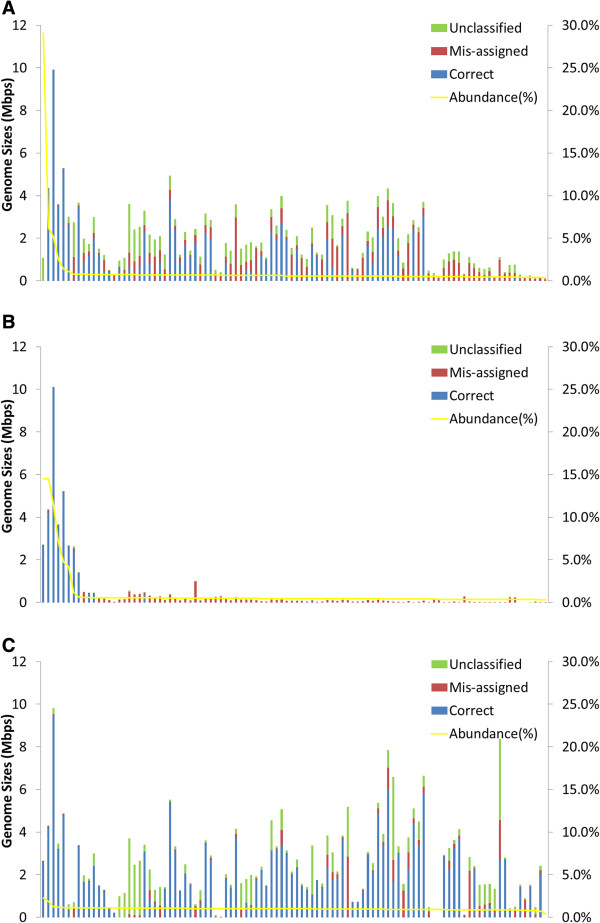
Binning performance estimated from three 100-genome simulated datasets. The graph settings are the same as for Figure 2. The species names of the genomes were indicated in Additional file 1: Table S2. (A) simLC + simulation. (B) simMC + simulation. (C) simHC + simulation.