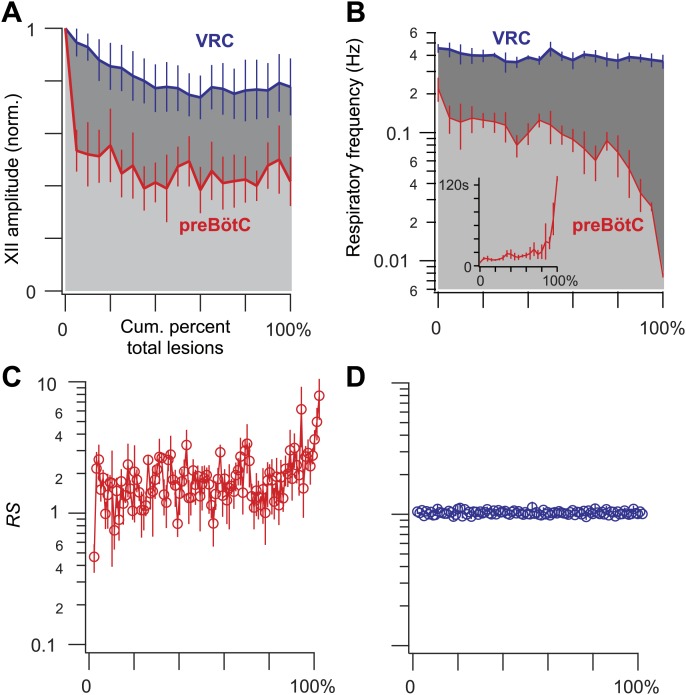
Figure 3. Ablation effects on respiratory frequency and the amplitude of XII motor output.
(A–D) Measurements are displayed in light grey and red for preBötC-surface slices and dark grey and blue for control slices that expose the ventral respiratory column (VRC). (A) XII amplitude and (B) respiratory frequency for preBötC-surface and control slices are plotted vs cumulative percent of total lesions during the ablation phase (bars show SD). Inset in B shows respiratory period in lieu of frequency (bars show SD) for preBötC-surface slices. (C and D) The regularity score (RS) is plotted vs cumulative percent of total lesions for preBötC-surface (C) and control slices (D). B, C, and D are plotted on semi-log axes. B and C are labeled with subordinate ticks at 2, 4, and 6. Tick labels are omitted from D because they match C exactly. B (inset) has linear axes.

