. 2014 Jul 29;3:e03023. doi: 10.7554/eLife.03023

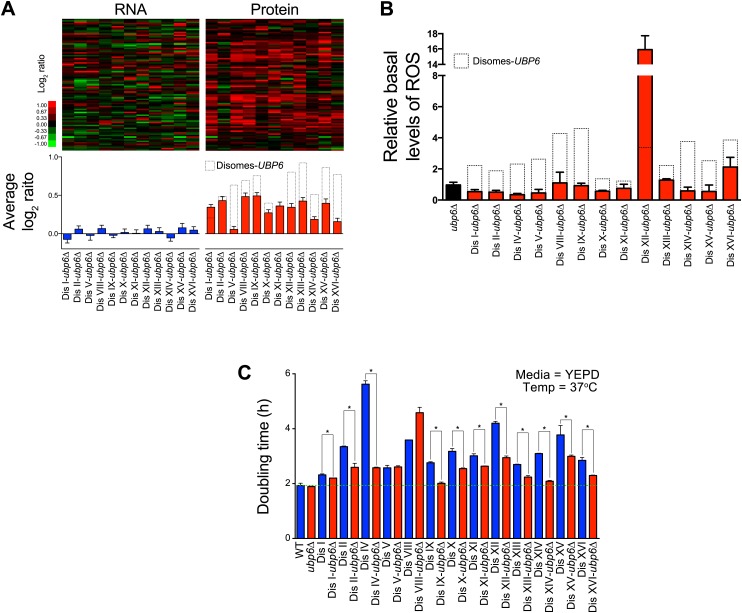
Figure 8. Loss of UBP6 attenuates cellular responses to aneuploidy.

(A) Comparison of transcript (left) and protein levels (right) of the APS in disomes-ubp6Δ. Averaged gene (blue bars) or protein (red bars) expression of the APS of each disomic strain are shown below. Error bars represent SEM. For comparison, dashed lines show the corresponding averages in disomes-UBP6. (B) Relative ROS levels of disomes-ubp6Δ grown in YEPD at 30°C. Error bars represent SD (n = 3). For comparison, dashed lines show the corresponding ROS levels in disomes-UBP6. (C) Doubling times of cells at 37°C. * refers to p-value < 0.05 (t test).

DOI: http://dx.doi.org/10.7554/eLife.03023.033

Figure 8—source data 1. List of strains utilized.
elife03023s009.xlsx (37.6KB, xlsx)
DOI: 10.7554/eLife.03023.034

Figure 8.

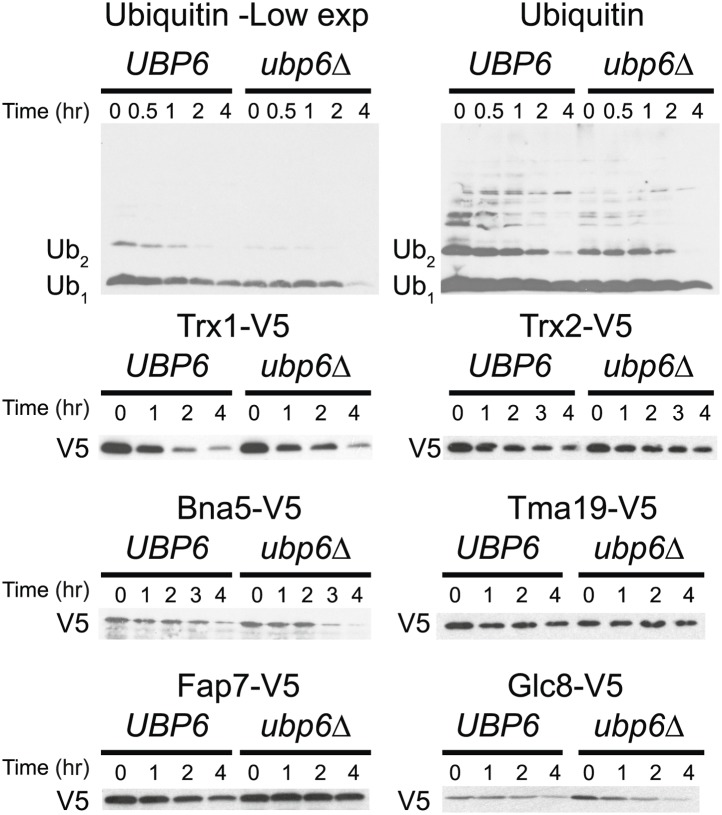
Figure 8—figure supplement 1. Cyclohexidime chases of Ubiquitin, Trx1, Trx2, Bna5, Tma19, Fap7 and Glc8 in wild-type cells or cells harboring the ubp6Δ.

Figure 8—figure supplement 1.

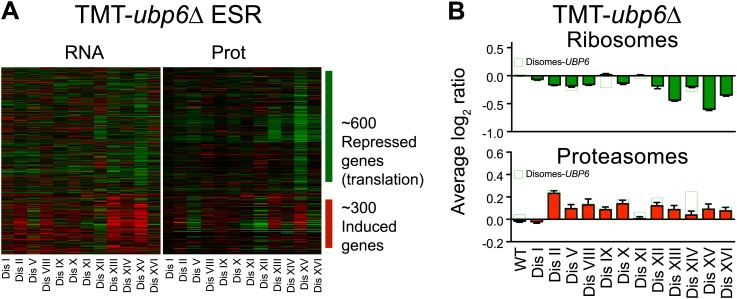
Figure 8—figure supplement 2. ESR, ribosome and proteasome levels in disomes-ubp6Δ.

Figure 8—figure supplement 2.

(A) Comparison of transcript (left) and protein levels (right) of the ESR of disomes-ubp6Δ relative to wild-type cells grown in YEPD medium. Down and upregulated genes are defined as in Gasch et al. (2000). (B) Averaged protein levels of ribosome (top) and proteasome subunits (bottom) of each disome-ubp6Δ relative to wild-type cells grown in YEPD medium. Error bars represent SEM.