
Fig. 6. Three dimensional imaging of TFH:B cell cognate pairs in LuN.
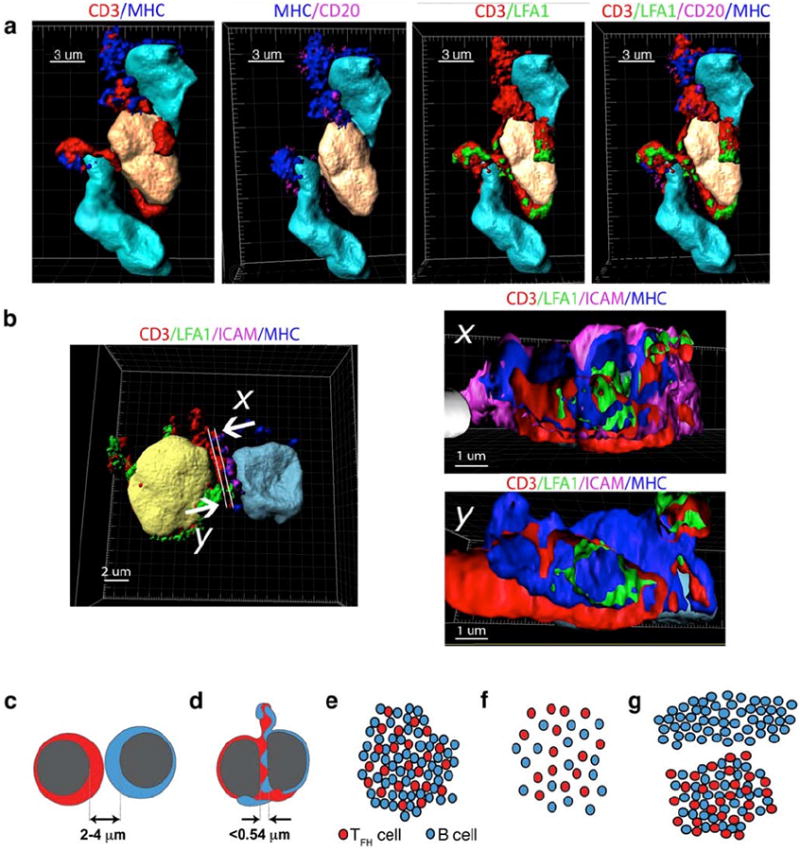
(a,b) Three-dimensional surface reconstructions from human lupus nephritis. (a) T cell (peach) flanked by two B cells (teal). Staining signatures for CD3 (red), LFA1 (green), CD20 or ICAM (magenta), and MHC class II (blue) are illustrated as well as their relationship to respective nuclei. (b) T follicular helper (TFH) cell (yellow), interacting with a B cell (teal)(left panel). Orthogonal two-dimensional cuts (right panels) illustrating segregation of CD3 and LFA1 on T cell (x and y) and of MHC class II and ICAM1 (magenta) on B cell surface (x). Directionality indicated by arrows. Scale in μm indicated for each image. (c-g) Schematic representation of relationships between cell distances, cell:cell interactions and global cellular organizations in inflamed tissue. Close packed cells usually have internuclear distances between 2 and 4 μm (c). However, when cells form cognate pairs, close proximities of less than 0.54 μm are established (d). In GC and LuN biopsies, TFH and B cells are closely aggregated and account for the great majority of both cell types in the biopsies (e). This is reflected in simple logarithmic homotypic and heterotypic relationships. In contrast, TCMR conjugate rates are much lower and cells are randomly (linear) distributed (f). Consequently, in MR cases, B cells exhibit divergent population distributions located either in aggregates with TFH cells or spatially segregated in TFH-independent infiltrations (g). These different cell relationships result in logarithmic TFH:B cell relationships and primarily linear B:B cell relationships.