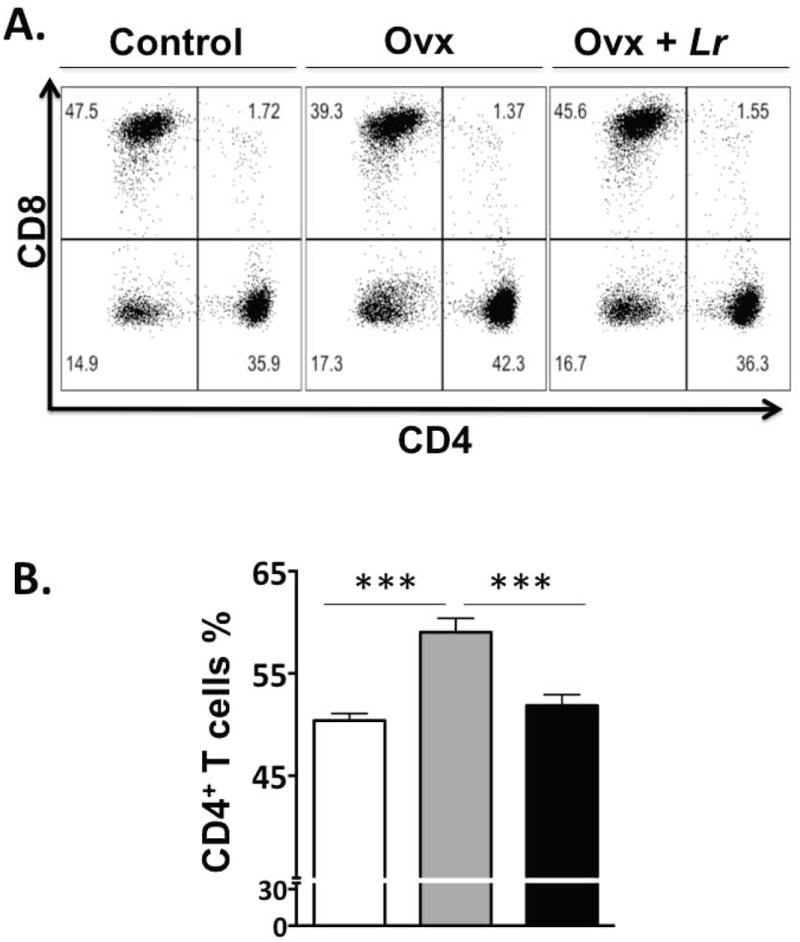
Fig 4. FACS analysis of bone marrow cells.

Control, OVX and OVX+LR mice were treated as described and femurs collected during euthanasia at 2 weeks after treatment. Femurs were flushed and bone marrow cells were collected, processed and stained for cell surface markers for identifying the various immune cells as described in the methods. CD4+ T-lymphocytes were identified as CD3+CD4+ T-cells; Dot plots are shown at the top and cumulative data presented in graph in the bottom. In the dot plots, the numbers in the quadrants indicate the percentage of cells. N=8 for each condition; ***P<0.001 as determined by ANOVA followed by Bonferroni.
