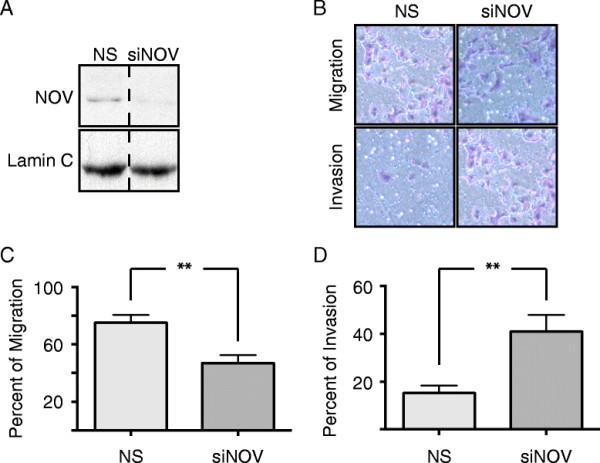
Figure 5.

NOV inhibits the invasiveness of MDA-MB-231 cells. (A) Representative Western blot for NOV (upper blot) and tubulin (lower blot) 48 h post-transfection with siRNA. Vertical dashed line indicates where image of gel was cut for figure. (B) Representative image of HEMA-3 stained cells, which migrated through either the control inserts (upper row) or Matrigel inserts (lower row) after 48 h of transfection with siRNA. (C) Quantification of 4 technical replicates of 2 biological replicates measuring the percent of cells that migrated through the control inserts (100 % being the number of cells loaded into the inserts). (D) Quantification of 4 technical replicates of 2 biological replicates measuring the percent of cells that invaded through the Matrigel normalized by the number of cells migrated through the control inserts. (A-D) NS = Non-silencing siRNA, siNOV = NOV siRNA. (C, D) Bars equal mean, error bars equal SEM. ** = Wilcoxon Rank Sum p-value < 0.01.
