
Figure 5.
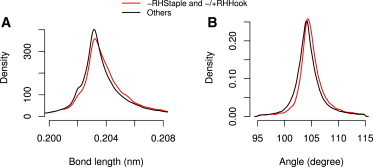
Statistical analysis of disulfide bonds in static protein structures. (Red curve) −RHStaple and −/+RHHook disulfides; (black curve) other disulfides. (A) S-S bond lengths, and (B) angles (both α1 and α2 in Fig. 1A) for −RHStaples and −/+RHHooks (red) and other disulfides (black). Distributions for −RHStaple and −/+RHHook bonds in panels A and B differ significantly from those of other bonds (Wilcoxon test).