
Figure 1.
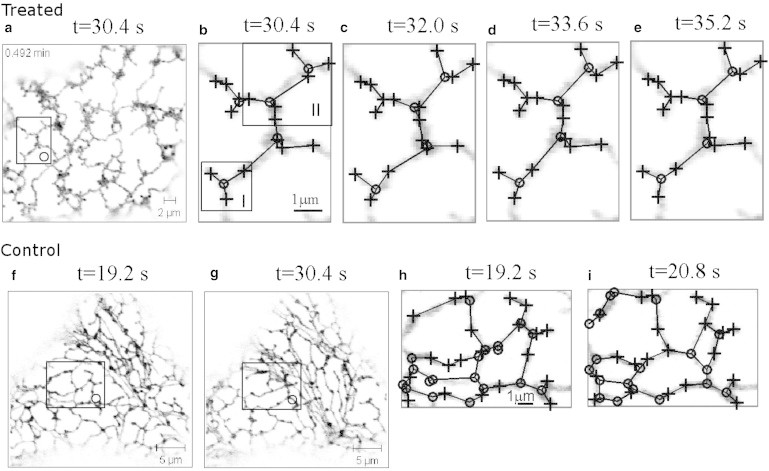
Illustration of the treated (top panels) and control (bottom panels) ER network and local dynamics. The rectangle Region O in panels a and f highlights a region with no cisternae. In control, panels f and g show a transition between the ER tubule and the cisternae in Region O. (b–e) Show details of the dynamics in Region O for treated and (h and i) show for control, with the geometric graphs (where plus-markers are persistent; o-markers are nonpersistent nodes; and lines are edges) abstracted from an image processing method as described in Image Processing Methods. Subregions I and II in panel b are used for modeling the dynamics of treated ER networks. The imaging data is taken from Sparkes et al. (9) (www.plantcell.org, Copyright American Society of Plant Biologists); dynamics in Region II is shown in Movie S1 and in control is shown in Movie S2, both found in the Supporting Material.