
Figure 2.
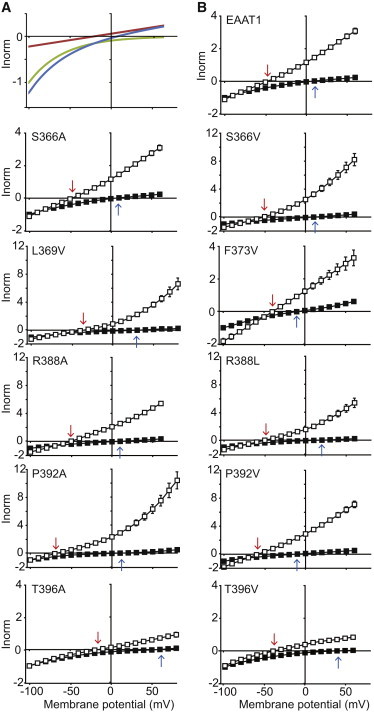
Substrate-activated current-voltage relationships for WT and mutant EAAT1 transporters. (A) Schematic current-voltage relationship showing the two components of the substrate-activated conductance of EAAT1 expressed in oocytes. The net aspartate-activated conductance (blue/solid line) is composed of the coupled transport component (green/dotted line) and the uncoupled Cl− component (red/dashed line). See Materials and Methods. (B) Current-voltage relationships for wild-type EAAT1 and mutant transporters elicited by 30 μM L-aspartate in either 96 mM Cl−-based buffer (solid squares) or 96 mM NO3−-based buffer (open squares). Currents were normalized (Inorm) to the substrate-elicited current at −100 mV in Cl−. (Arrows) Reversal potential of the substrate-activated conductance in Cl−-based buffer (blue/open arrow) and NO3−-based buffer (red/solid arrows). Reversal potentials are also listed in Table 1. Note that different scales are used for various mutant transporters. Where error bars cannot be seen, they lie within the symbol. Data shown represents the mean ± SE (n ≥ 3). To see this figure in color, go online.