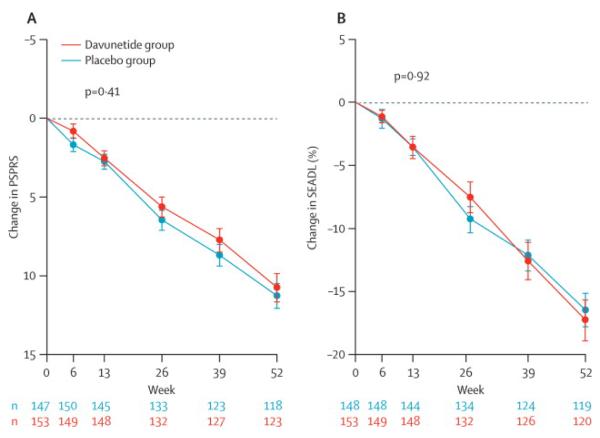
Figure 2. Change from baseline in primary outcome measures, the PSPRS and SEADL.
(A) Least squares mean ± SEM change from baseline in PSPRS from primary ITT analysis. P = 0.41. An increase in PSPRS indicates worse disease.
(B) Least squares mean ± SEM change from baseine in SEADL from primary ITT analysis. P = 0.92. A decrease in SEADL indicates worse performance.

