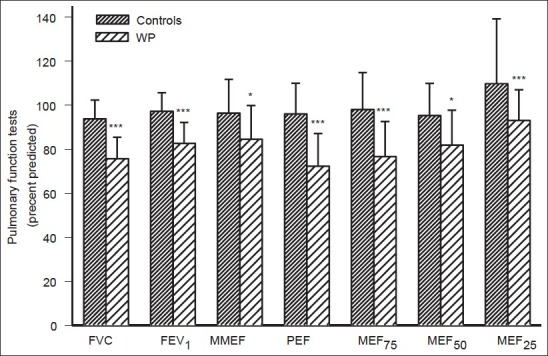
Figure 2.

Comparison of pulmonary functional tests (PFT) between water pipe (WP) smokers and non smokers (controls) subjects. Values were presented as mean ± SD of percent predicted (for smokers and non smokers n = 58 and 50 respectively). FVC = Forced vital capacity, FEV1 = Forced expiratory volume in one second, MMEF = Maximal mid expiratory flow, PEF = Peak expiratory flow, MEF75, MEF50, and MEF25 = Maximal expiratory flow at 75%, 50%, and 25% of the FVC, respectively. * = P < 0.005, * = P < 0.001
