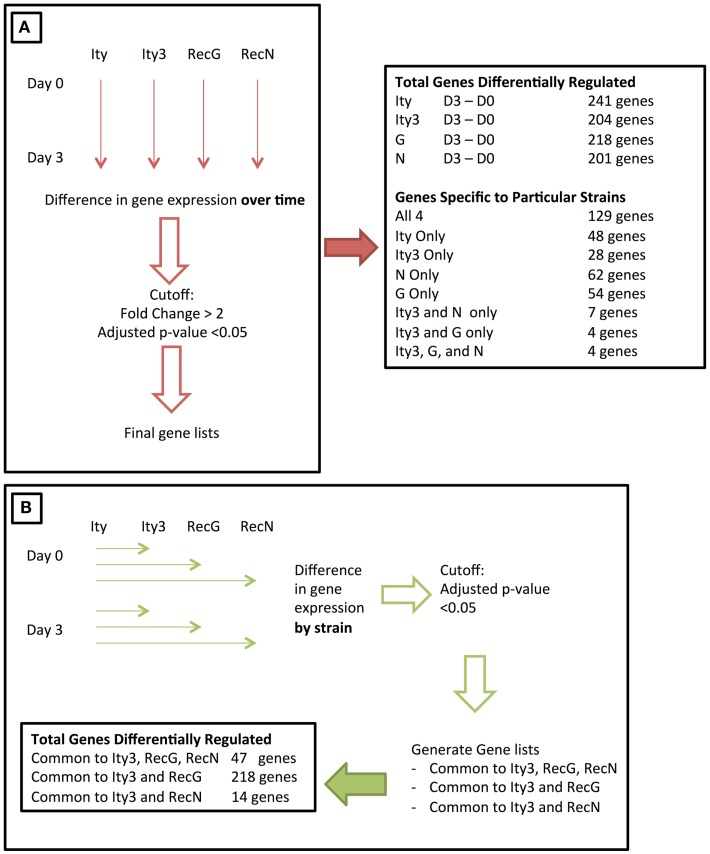
Figure 1.
Figure illustrating the two approaches used to study the changes in gene expression during infection of congenic and sub-congenic mice. (A) A representation of an initial approach used for studying the change in gene expression over time. The gene expression at day 3 post-infection was compared to day 0, and the final number of genes differentially regulated is stated on the right. (B) The second approach used, where gene expression in each strain was compared to the control Ity strain, at both day 0 and day 3. The final number of genes within each category is shown at the bottom of the panel.

